Explanation of the BLAST output
The BLAST output comes in different flavors. On the NCBI web page the default output is html, and the following description will use the html output as example. Ordinary text and xml output for easy computational parsing is also available.The default layout of the NCBI BLAST result is a graphical representation of the hits found, a table of sequence identifiers of the hits together with scoring information, and alignments of the query sequence and the hits.
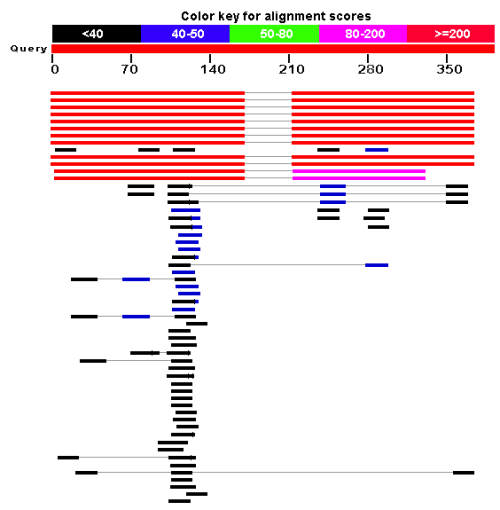
Figure 12.19: BLAST graphical view. A simple graphical overview of the hits found aligned to the query sequence. The alignments are color coded ranging from black to red as indicated in the color label at the top.
The graphical output (shown in figure 12.19) gives a quick overview of the query sequence and the resulting hit sequences. The hits are colored according to the obtained alignment scores.
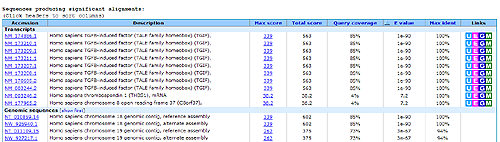
Figure 12.20: BLAST table view. A table view with one row per hit, showing the accession number and description field from the sequence file together with BLAST output scores.
The table view (shown in figure 12.20) provides more detailed information on each hit and furthermore acts as a hyperlink to the corresponding sequence in GenBank.
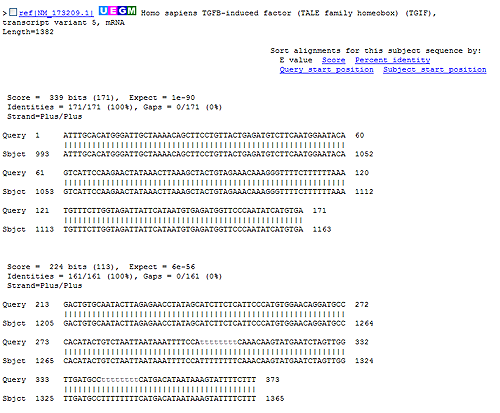
Figure 12.21: Alignment view of BLAST results. Individual alignments are represented together with BLAST scores and more.
In the alignment view one can manually inspect the individual alignments generated by the BLAST algorithm. This is particularly useful for detailed inspection of the sequence hit found(sbjct) and the corresponding alignment. In the alignment view, all scores are described for each alignment, and the start and stop positions for the query and hit sequence are listed. The strand and orientation for query sequence and hits are also found here.
In most cases, the table view of the results will be easier to interpret than tens of sequence alignments.