T-tests
For experiments with two groups you can, among the Gaussian tests, only choose a T-test as shown in figure 27.83.
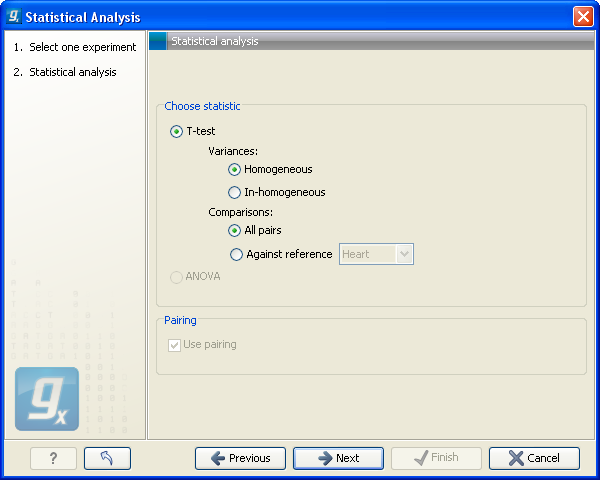
Figure 27.83: Selecting a t-test.
There are different types of t-tests, depending on the assumption you make about the variances in the groups. By selecting 'Homogeneous' (the default) calculations are done assuming that the groups have equal variances. When 'In-homogeneous' is selected, this assumption is not made.
The t-test can also be chosen if you have a multi-group experiment. In this case you may choose either to have t-tests produced for all pairs of groups (by clicking the 'All pairs' button) or to have a t-test produced for each group compared to a specified reference group (by clicking the 'Against reference' button). In the last case you must specify which of the groups you want to use as reference (the default is to use the group you specified as Group 1 when you set up the experiment).
If a experiment with pairing was set up (see Set up experiment) the Use pairing tick box is active. If ticked, paired t-tests will be calculated, if not, the formula for the standard t-test will be used.
When a t-test is run on an experiment four columns will be added to the experiment table for each pair of groups that are analyzed. The 'Difference' column contains the difference between the mean of the expression values across the samples assigned to group 2 and the mean of the expression values across the samples assigned to group 1. The 'Fold Change' column tells you how many times bigger the mean expression value in group 2 is relative to that of group 1. If the mean expression value in group 2 is bigger than that in group 1 this value is the mean expression value in group 2 divided by that in group 1. If the mean expression value in group 2 is smaller than that in group 1 the fold change is the mean expression value in group 1 divided by that in group 2 with a negative sign. The 'Test statistic' column holds that value of the test statistic, and the 'P-value' holds the two-sided p-value for the test. Up to two more columns may be added if the options to calculate Bonferroni and FDR corrected p-values were chosen (see 27.7.3).