Peak table and annotations
The main result is the table showing the peaks and the annotations added to the reference sequence.An example of a peak table is shown in figure 29.6.
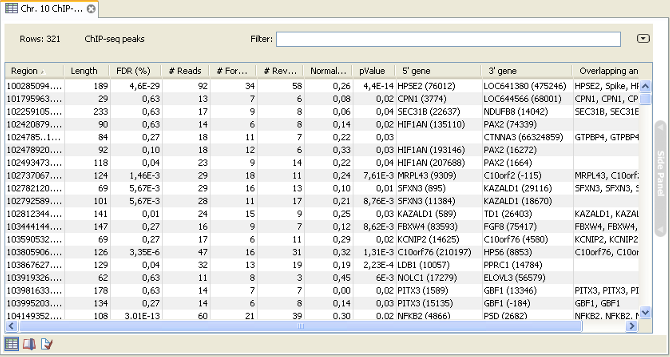
Figure 29.6: ChIP sequencing peak table.
The table includes information about each peak that has been found:
- Name. If the mapping was based on more than one reference sequence, the name of the reference sequence in question will be shown here.
- Region. The position of the peak. To find that position in the ChIP-sample mapping, you can make a split view of the table and the mapping. You will then be able to browse through the peaks by clicking in the table. This will cause the view to jump to the position of the peak region.
- Length. The length of the peak.
- FDR (%). The false discovery rate for the peak (learn more in Peak finding and false discovery rates).
- # Reads. The total number of reads covering the peak region.
- # Forward reads. The number of forward reads covering the peak region.
- # Reverse reads. The number of reverse reads covering the peak region. The normalized difference in the count of forward-reverse reads is calculated based on these numbers (see figure 29.2).
- Normalized difference. See Peak refinement.
- P-value. The p-value is for the Wilcoxon rank sum test for the equality of location of forward and reverse reads in a peak. See Peak refinement.
- Max forward coverage. The refined region described in Peak refinement is calculated based on the maximum coverage of forward and reverse reads.
- Max reverse coverage. See previous.
- Refined region. The refined region.
- Refined region length. The length of the refined region.
- 5' gene. The nearest gene upstream, based on the start position of the gene. The number in brackets is the distance from the peak to the gene start position.
- 3' gene. The nearest gene downstream, based on the start position of the gene. The number in brackets is the distance from the peak to the gene start position.
- Overlapping annotations. Displays any annotations present on the reference sequence that overlap the peak.
An example of a peak is shown in figure 29.7.
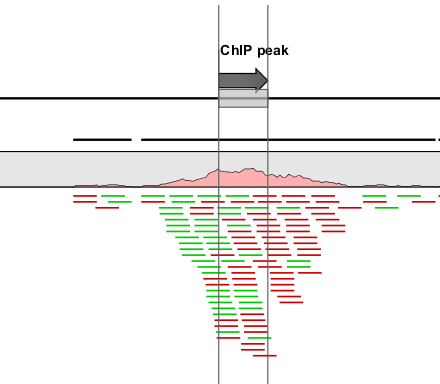
Figure 29.7: Inspecting an annotated peak. The green lines represent forward reads and the red lines represent reverse reads.
If you want to extract the sequence of all the peak regions to a list, you can use the Extract Annotations plug-in (see http://www.clcbio.com/index.php?id=938) to extract all annotations of the type "Binding site".