Analyze QIAseq xHYB Mycobacterium tuberculosis and NTM-ID Panel Data (Human host)
The Analyze QIAseq xHYB Mycobacterium tuberculosis and NTM-ID Panel Data (Human host) template workflow is designed to analyze sample data from human hosts generated with the QIAseq xHYB Mycobacterium tuberculosis Panel and/or the QIAseq xHYB NTM-ID Panel. The workflow can analyze data from either or both, depending on settings chosen when running the workflow.
QIAGEN Reference Data Set
The QIAseq xHYB Mycobacterium tuberculosis Panel and QIAseq xHYB NTM-ID Panel Reference Data Sets contain reference data relevant for this template workflow, such as the Mycobacterium tuberculosis reference genome H37Rv, the WHO Mycobacterium tuberculosis variant database based on the WHO Mycobacterium tuberculosis mutation catalogue, and a non-redundant reference database of the hsp65 gene, used for detection and typing of Mycobacteriaceae. Like the template workflow, the reference data sets are designed for human samples, and additionally contain human host and human control gene references.
The QIAseq xHYB Mycobacterium tuberculosis Panel reference data set also comes in a version with an alternative reference. This reference includes the standard Mycobacterium tuberculosis H37Rv genome supplemented with experimental alternative regions derived from other strains. These regions allow variant calling outside H37Rv but are not guaranteed to be complete or fully accurate.
Reference data not already downloaded can be downloaded during the launch of the workflow. It can also be downloaded, as well as managed, using the Reference Data Manager, which can be opened by clicking on the Manage Reference Data (![]() ) button in the Toolbar. Click on the QIAGEN Sets Reference Data Library tab in the Reference Data Manager and search for the sets by entering terms from their names in the search field.
) button in the Toolbar. Click on the QIAGEN Sets Reference Data Library tab in the Reference Data Manager and search for the sets by entering terms from their names in the search field.
For analysis of samples not from human hosts: If a non-human host is relevant for your application, you can download a host genome using Download Custom Microbial Reference Database, and create a host taxonomic profiling index from your host genome using Create Taxonomic Profiling Index.
Then, you can create a copy of the workflow and edit it to fit your specific application, see Template workflows. Since the workflow elements Map Reads to Human Control Genes and QC for Targeted Sequencing is relevant for human data only, you should delete these. In addition, if a host genome is not relevant for you application, you can remove the host inputs from Find Best References using Read Mapping and Taxonomic Profiling.
Once the workflow copy is customized, you can install it to make it available from the Workflows menu (see Workflow installation).
The workflow analysis
The raw reads are trimmed for low quality, read-through adapter sequences, and G homopolymers. As quality control of succesful hybrid capture, human host reads are mapped to the human control genes, based on the probes included in the panels.
For the Mycobacterium tuberculosis (M. tuberculosis) analysis, unfiltered trimmed reads are used as input for the separate spoligotyping analysis. Before mapping, the same reads are filtered using Taxonomic Profiling. Here, reads that map to the human host and reads belonging to phyla other than Actinobacteriota are filtered away.
The remaining reads are mapped to the M. tuberculosis H37Rv reference genome, and variants are called from this read mapping. Variant calling is optimized for calling resistance in the dominant strain of an infection: variants with frequency beneath 50% will typically not be reported.
Detected variants are compared to the WHO drug resistance variant database and annotated with drug resistance information. Larger InDels that cannot be matched to the variant database exactly (e.g. whole-gene deletions), but that overlap with possible resistance InDels, are reported as candidate InDels and annotated with information from all resistance InDels that they overlap (for more, see WHO Candidate InDels).
To run the workflow using a variant database other than the default one, you need to modify the workflow elements where the database name appears as a column header, such as Filter for WHO variants and WHO variant associated with resistance.
For the Non-Tuberculous Mycobacteria-ID (NTM-ID) analysis, trimmed and filtered reads are mapped to the references of Mycobacteriaceae hsp65 genes using Find Best References using Read Mapping. Due to the high level of similarity between hsp65 genes from different Mycobacteriaceae species, the reads are mapped with stringent mapping parameters.
This results in an intial set of hsp65 reads and possible references. If more than one possible reference is detected for the sample reads, the analysis will try to refine the references by only looking at non-ambiguous reads mapping to this subset of the references. This helps to resolve false positive species calls as a result of the high level of similarity within the target gene.
While the detected species may contain a "variant" name (e.g. "Mycobacterium tuberculosis variant bovis"), be advised that the hsp65 gene is usually not specific enough for strain level typing - only species level typing. For mixed infections involving more than one Mycobacteriaceae species, the lower detection limit is 3% abundance relative to the most abundant species.
After reference refinement, all of the hsp65 reads will be re-mapped to the final refined list of references, and the detected species and read mapping statistics are output in the report.
Launching the workflow
The Analyze QIAseq xHYB Mycobacterium tuberculosis and NTM-ID Panel Data (Human host) workflow is available at:
Workflows | Template Workflows (![]() ) | Microbial Workflows (
) | Microbial Workflows (![]() ) | QIAseq Analysis (
) | QIAseq Analysis (![]() ) | Analyze QIAseq xHYB Mycobacterium tuberculosis and NTM-ID Panel Data (Human host) (
) | Analyze QIAseq xHYB Mycobacterium tuberculosis and NTM-ID Panel Data (Human host) (![]() )
)
Launch the workflow and step through the wizard.
- Specify which QIAseq xHYB Panel(s) were used to generate the reads. The following options are available:
- Mycobacterium tuberculosis. Select this option if the QIAseq xHYB Mycobacterium tuberculosis Panel was used on its own. Only the M. tuberculosis analysis will be performed.
- NTM-ID. Select this option if the QIAseq xHYB NTM-ID Panel was used on its own. Only the NTM-ID analysis will be performed.
- Both. Select this option if the QIAseq xHYB NTM-ID Panel was used in conjunction with the QIAseq xHYB Mycobacterium tuberculosis Panel. Both the M. tuberculosis and the NTM-ID analysis will be performed.
- Select the sequence list(s) containing the sample reads. If selecting multiple inputs from different samples, check the Batch option (see Running workflows in batch mode).
- Select a reference data set or select "Use specified data elements". The latter runs the workflow using default elements, which can be viewed by clicking the "workflow roles" text just above the option.
- If Batch was checked in step 1, choose whether batch units should be defined based on organization of the input data, or by provided metadata. In the next step, review the batch units resulting from your selections above.
- If you selected "Mycobacterium tuberculosis" or "Both" in the first step, specify the spoligotyping settings (figure 2.31). Using the default values is usually sufficient, but we recommend taking a look at the spoligotyping report afterwards to make sure the results are as expected.
- If you selected "NTM-ID" or "Both" in the first step, the parameters for filtering Mycobacteriaceae references can be changed (figure 2.32). This might be necessary if the expected Mycobacteriaceae species is present in the sample at a very low abundance. The default settings are expected to work in most cases. For more information about the filters, see Find Best References using Read Mapping.
- If you selected "NTM-ID" in the first step, additional summary items have been set. These are guidelines to help evaluate the quality of the results (see Create Sample Report). Thresholds can be changed, if the defaults are too stringent for the input sample(s).
- Finally, select a location to save outputs to.
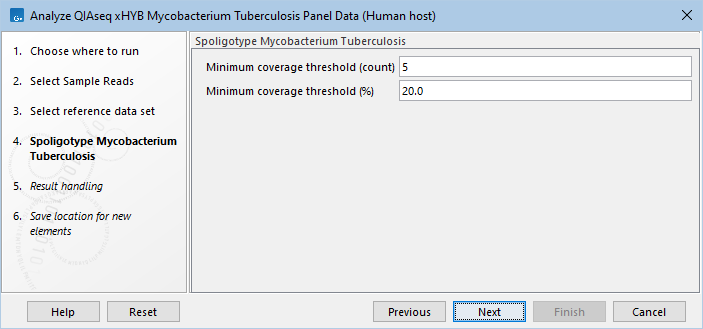
Figure 2.31: Select the minimum threshold settings for spoligotyping.
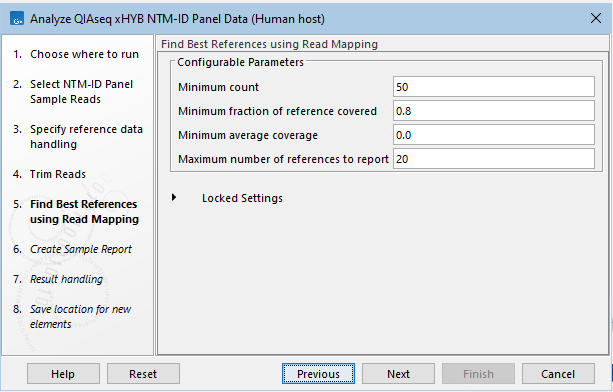
Figure 2.32: Parameters for filtering Mycobacteriaceae references can be changed.
Workflow outputs and how to interpret
The outputs differ depending on which analyses have been run. To jump to specific output sections, you can use the links below:
M. tuberculosis analysis outputs
NTM-ID analysis outputs (with M. tuberculosis analysis)
NTM-ID only analysis outputs (without M. tuberculosis analysis)
M. tuberculosis analysis outputs
The outputs provided by the M. tuberculosis analysis are:
- QC & Reports. Folder containing the individual reports generated during the analysis.
- All reports from the sample report are found here in their full length.
- Tracks. Folder containing various tracks.
- Genome, Gene and CDS tracks based on the M. tuberculosis reference used.
- Human control genes read mapping. Track to see mapping of the human host reads to the control genes.
- Read mapping. Reads track of the sample reads mapping to the reference genome.
- Amino acid track. Track to see amino acids and potential changes in coding sequences of the reference genome.
- WHO mycobacterium tuberculosis variant database (filtered). The WHO resistance database, filtered to only contain Insertions and Deletions overlapping with candidate InDels (for more, see WHO Candidate InDels).
- Variants. Folder containing all the variant tracks generated during the analysis.
- Raw variants. Variant track containing all raw variants detected by Fixed Ploidy Variant Detection i.e., before adjusting with Join Nearby Variants and annotating.
- Filtered InDels. InDels detected by InDels and Structural Variants that were not already present in the "Raw variants" track. Only InDels with a variant ratio over 0.5 are reported. These InDels are later merged with the other variants and included in the "Annotated variants" track.
- WHO variants detected. Variant track containing only variants from the WHO resistance database.
- Novel variants detected. Variant track containing only variants that are not graded by the WHO.
- WHO candidate InDels. Annotation track containing insertions, deletions and "complexes" that may correspond to a WHO-graded variant, but which it was not possible to match to the resistance database exactly (for more, see WHO Candidate InDels).
- Genome Browser. A track list containing the reference genome, gene, CDS, read mapping, variant, candidate InDels, and amino acid changes tracks.
- QIAseq xHYB Mycobacterium Tuberculosis Analysis Report. Sample report containing results of the analysis. The sample report is curated to contain the most important information for analysis interpretation, but all full reports can be found in the QC & Reports folder.
- Annotated variants. Variant track containing all detected variants and non-candidate InDels after readjustment and annotated with WHO resistance, amino acid changes and gene information.
The sample report "QIAseq xHYB Mycobacterium Tuberculosis Analysis Report" is the main output of the workflow. This allows for easy overview of the analysis results, both in terms of quality control and detected drug resistance for the sample. An example of the report can be seen in figure 2.33.
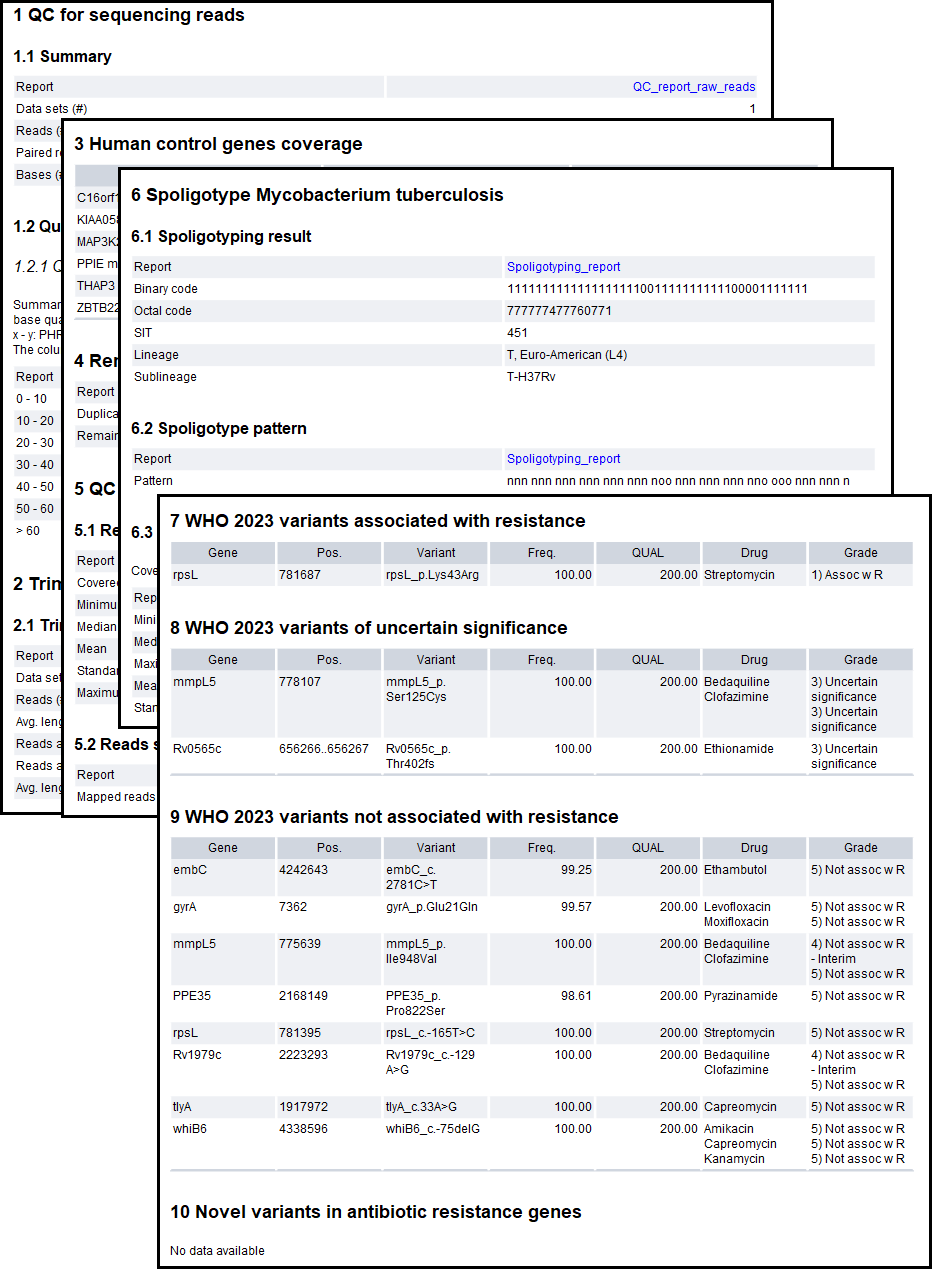
Figure 2.33: An example report from the M. tuberculosis analysis part of the workflow.
The report contains the following sections:
- Sections 1-5 contain quality metrics for the analysis:
- QC for sequencing reads. A summary of the number of raw reads and their quality. If the reads are of too low quality, the results may be unreliable.
- Trim reads. A summary of the read trimming. If the percentage of reads after trim is low or the average read length after trimming is considerably lower than before trimming, it may be a sign that something is wrong with the sample reads.
- Human control genes coverage. A summary of the host reads mapping to the human control genes. The coverage can be low, but there should be some reads mapping to the genes. If not, something may have gone wrong during the sample prep, or the sample was not made with the QIAseq xHYB Mycobacterium tuberculosis Panel.
- Remove duplicate mapped reads. A high percentage of duplicates may indicate that the sample contains little gDNA.
- QC for read mapping. For the QIAseq xHYB Mycobacterium tuberculosis Panel, the coverage percentage should be close to 100%. Also, most of the reads after trimming (see Reads after trim in the Trim reads section) should be mapped. If this is not the case, there may have been an issue with the sample prep.
- Sections 6-11 contain lineage and variant results from the analysis:
- Spoligotype Mycobacterium tuberculosis. Results of spoligotyping. This reports on the detected SIT, lineage, sublineage, and spoligotype pattern. It can be a good idea to take a look at the coverage plot in the full spoligotyping report (/QC & Reports/Spoligotyping report), to ascertain whether the minimum threshold has been correctly set. For additional information about the spoligotype report content, see Spoligotype Mycobacterium Tuberculosis output.
- WHO 2023 variants associated with resistance. Variants detected in the sample that have been graded "1)" or "2)" for at least one drug by the WHO. As variants can be graded for multiple drugs with different grades, this section may contain grades of "3)" and higher as well. For information about WHO grading, see Reference Data Elements.
- WHO 2023 variants of uncertain significance. Variants detected in the sample that have been graded "3)" for at least one drug by the WHO, but not "1)" or "2)". As variants can be graded for multiple drugs with different grades, this section may contain grades of "4)" and higher as well.
- WHO 2023 variants not associated with resistance. Variants detected in the sample that have only been graded "4)" or "5)" by the WHO.
- WHO 2023 candidate InDels. InDels detected in the sample that overlap one or more WHO-graded InDels (for more, see WHO Candidate InDels).
- Novel variants in antibiotic resistance genes. Variants detected in the sample, but that are not graded by the WHO. The report only contains variants in known resistance genes, and excludes variants in protein-coding regions that result in synonymous mutations. To view all detected novel variants, look at the "/Variants/Novel variants detected" variant track.
The variant table reports contain the following columns:
- Gene. For WHO variants, this is the gene with which the variant is associated. For Novel variants, it is the gene in which the variant is located.
- Pos.. The genomic position of the variant within the reference genome.
- Variant (Only WHO variants). The name(s) of the variant as given by WHO. The name consists of the gene in which the variant is located, along with the corresponding position and change, either as a nucleotide or amino acid change.
- AA change (Only Novel variants). This describes the change on the protein level. For example, single amino-acid changes caused by SNVs are listed as p.Gly261Cys, denoting that in the protein sequence (hence the "p.") the Glycine at position 261 is changed into Cysteine. Frame-shifts caused by nucleotide insertions and deletions are listed with the extension fs, for example p.Pro244fs denoting a frameshift at position 244 coding for Proline. For further details about HGVS nomenclature as relates to proteins, see http://varnomen.hgvs.org/recommendations/protein/.
- Freq.. The number of reads supporting the allele divided by the number of reads covering the position of the variant. Note that variants with frequency beneath 50% will typically not be reported.
- QUAL. Measure of the significance of a variant, i.e., a quantification of the evidence (read count) supporting the variant, relative to the coverage and what could be expected to be seen by chance, given the error rates in the data. For additional information, see Variant tracks.
- Drug (Only WHO variants). The antimicrobial resistance drug(s) for which the variant is graded.
- Grade (Only WHO variants). The grade of drug resistance determined for the variant.
The candidate InDels table report contains the following unique columns (for more, see WHO Candidate InDels):
- Variant type. The type of variant detected, either "Deletion", "Insertion" or "Complex". A "Complex" variant indicates that more than two breakpoints give rise to the structural variant.
- Ratio. Ratio of reads calculated as the sum of the 'Non perfect mapped' reads for the breakpoints used to infer the InDel, divided by the sum of the 'Non perfect mapped' and 'Perfect mapped' reads for the breakpoints used to infer the InDel. Note that variants with ratio beneath 50% will not be reported.
- Evidence. The mapping evidence on which the call of the InDel was based (see Theoretically expected structural variant signatures).
- Candidate Drug(s). The antimicrobial resistance drug(s) for which variants overlapping with the candidate InDel are graded.
- Candidate Grade(s). The grade(s) of drug resistance determined for variants overlapping with the candidate InDel.
If no variants are detected in a section of the report, it will say "No data available".
For more info on the WHO variant database, including the resistance grades, see Reference Data Elements.
WHO 2023 candidate InDels
Candidate InDels are structural variants that overlap, but do not exactly match, a WHO-graded variant. These include large deletions that may cause loss of function of a resistance-associated gene. Only deletions that overlap with a WHO deletion, and insertions that overlap with a WHO insertion are included. Complexes are included if they overlap with either.
Candidate InDels are called by InDels and Structural Variants as Deletions, Insertions or Complexes. A complex is usually called in regions with more than 2 signature breakpoints (see Structural Variants and InDels output).
As candidate InDels may overlap with many resistance-associated variants, these are not listed individually. Instead the "Candidate Drug(s)" column includes all possible drugs to which the variants may confer resistance. Similarly, the "Candidate Grade(s)" column includes all possible grades of resistance associated with those variants. To avoid redundancy, each drug and grade will only be reported once in the column, even if multiple variants are associated with that drug and grade.
A candidate InDel is not a guarantee of resistance or susceptibility, but an indicator that one should take a closer look at that location in the read mapping, to evaluate whether the variant is of interest.
A good way to investigate a candidate InDel further is to open up the "Genome Browser" track list output from the analysis and zoom into the candidate InDel's location. In figure 2.34 it is clear from the read mapping that a large deletion is present where the "Complex" is called.
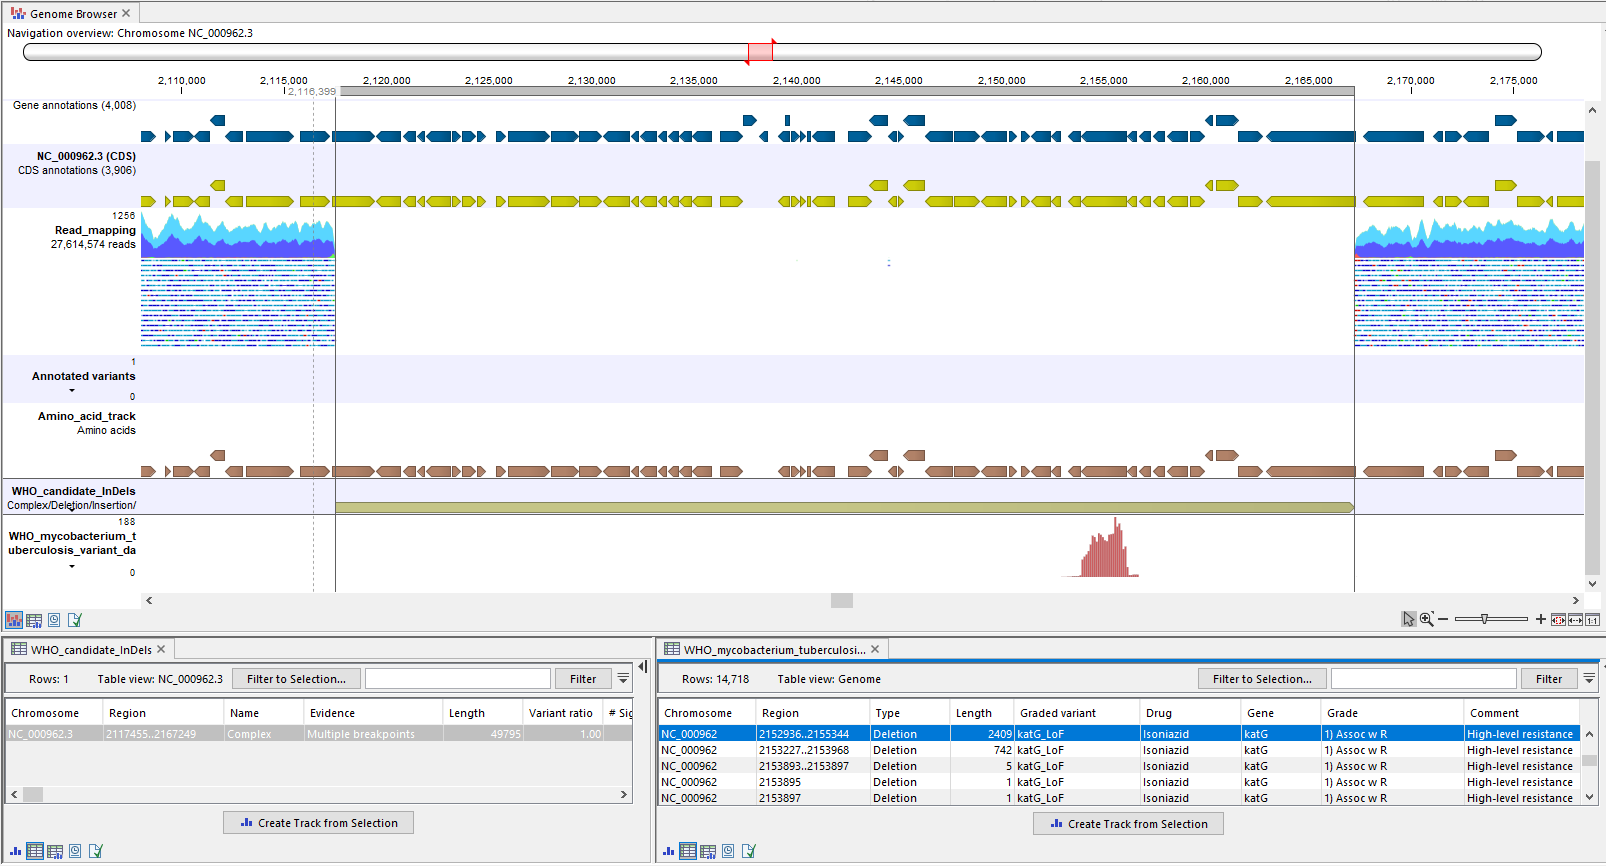
Figure 2.34: A candidate complex called in a region of the genome where the read mapping clearly lacks coverage, indicating that the complex is a deletion. In the filtered WHO resistance database track (bottom), it can be seen that the candidate complex, now confirmed to be a deletion, overlaps with multiple large WHO LoF deletions.
Candidate InDels are annotated with both WHO insertions and deletions, so it is necessary to take a closer look at the variants to determine whether candidate drug resistance from the report is supported. The "WHO mycobacterium tuberculosis variant database (filtered)" track in the Genome Browser can help to investigate whether the InDel overlaps with a meaningful WHO variant. In figure 2.34 the candidate deletion overlaps with multiple WHO loss of function deletions, which confer resistance to the drug Isoniazid. It can be inferred that a large deletion will confer similar resistance (see also pages 88 and 102 about "feature_ablation" in [WHO, 2023]).
NTM-ID analysis outputs (with M. tuberculosis analysis)
If you selected "NTM-ID" when running the analysis, see NTM-ID only analysis outputs (without M. tuberculosis analysis), instead.
The reads used as input for the NTM-ID analysis in this part of the workflow, are extracted from the hsp65 gene region of the H37Rv read mapping. Due to the high level of similarity between hsp65 genes from different Mycobacteriaceae species, reads are expected to map to this region, even if they don't come from H37Rv.
The outputs provided by the NTM-ID analysis when performed together with the M. tuberculosis analysis are:
- NTM-ID Panel Analysis (Only if a positive result was detected). Folder containing results from the analysis.
- Mycobacteriaceae reads. Sequence lists (single and paired) containing reads from the input that mapped to the hsp65 references before refinement of references.
- Mycobacteriaceae read mapping. Reads track of the reads mapped to the final hsp65 references.
- QIAseq xHYB NTM-ID Analysis Report. The report is curated to contain the most important information for analysis interpretation. All full reports are linked throughout this report or can be found in the QC & Reports folder.
The report icon will be colored based on whether Mycobacteriaceae was detected.- A green dot on the report icon indicates detection of at least one Mycobacteriaceae species.
- A red dot on the report icon indicates no detection of Mycobacteriaceae species.
The "QIAseq xHYB NTM-ID Analysis Report" report contains the following sections:
- Summary. A summary of the QC summary item "Percentage reads mapped to reference" and whether it passed (green) or failed (red).
- Find best references using read mapping. Contains a summary of how many of the input reads mapped to the hsp65 references and how many were unmapped. These are the mapping statistics before refinement of the references, and may not match the number of reads mapped to the reference(s) in the following sections. To see more details of the results prior to refinement, see the "Find best reference report" in the "QC & Reports" folder.
- QC for Mycobacteriaceae mapping (Only if a positive result was detected). Contains the name of the reference(s) detected after refinement of references and mapping statistics for the reads mapped to them. Details about the columns:
- Name. The name of the Mycobacteriaceae species reference detected.
- Reference. The accession number of the reference.
- Mapped reads. The number of reads mapped to the reference.
- Non-specific matches. The number of reads that mapped equally well to multiple positions in the set of detected references.
- Reads in aligned pairs. The number of reads mapped in pairs to the reference.
- Fraction of reference covered. The fraction of the reference covered by at least one read.
- Average coverage. The number of nucleotides mapped to the reference divided by the reference length.
NTM-ID only analysis outputs (without M. tuberculosis analysis)
If you selected "Both" when running the analysis, see NTM-ID analysis outputs (with M. tuberculosis analysis), instead.
The outputs provided by the NTM-ID only analysis are:
- QC & Reports. Folder containing the individual reports generated during the analysis.
- All reports from the sample report are found here in their full length.
- Mycobacteriaceae full mapping statistics table, which the Mycobacteriaceae mapping report is based on.
- Outputs. Folder containing results from the analysis.
- Human host read mapping. Track to see mapping of the human host reads and from which the QC for human control genes report section was derived.
- Mycobacteriaceae reads (Only if a positive result was detected). Sequence lists (single and paired) containing reads from the input that mapped to the hsp65 references before refinement of references.
- Mycobacteriaceae read mapping (Only if a positive result was detected). Reads track of the reads mapped to the final hsp65 references.
- Typing Report. The sample report is curated to contain the most important information for analysis interpretation. All full reports are linked throughout the Sample report or can be found in the QC & Reports folder. The Sample report icon will be colored based on whether Summary item thresholds were met (see the "Quality control" section in the sample report for specifics):
- A green dot on the report icon indicates detection of at least one Mycobacteriaceae species, and all quality control thresholds passed.
- A yellow dot on the report icon indicates detection of at least one Mycobacteriaceae species, but not all quality control thresholds passed.
- A red dot on the report icon indicates no detection of Mycobacteriaceae species. The report must be opened to determine whether quality control thresholds passed.
The Typing Report is the main output of the workflow. This allows for easy overview of the analysis results, both in terms of quality control and detected Mycobacteriaceae for the sample. An example of the report can be seen in figure 2.35.
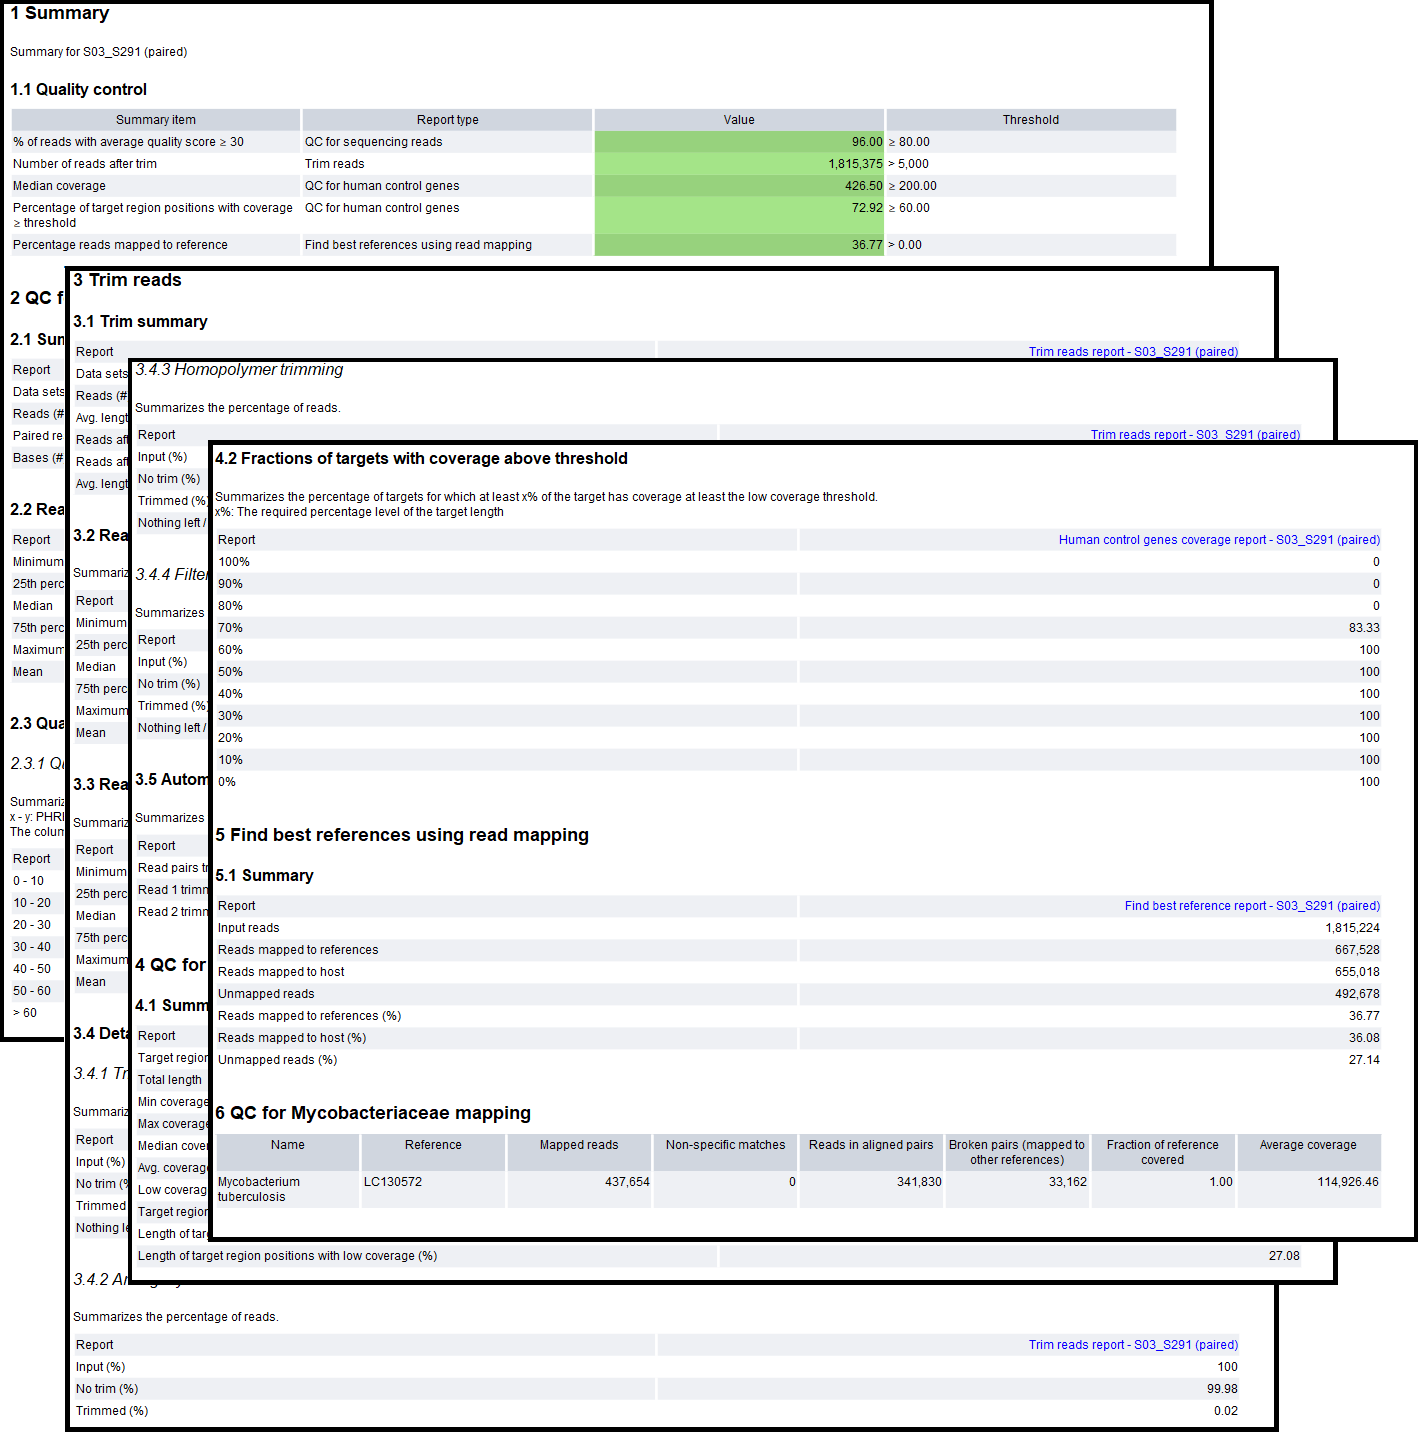
Figure 2.35: An example report from the NTM-ID only analysis part of the workflow.
The report contains the following sections:
- Sections 1-4 contain quality metrics for the analysis:
- Summary. A summary of the QC summary items and whether they passed (green) or failed (yellow). The "Percentage reads mapped to reference" will be red if no Mycobacteriaceae species was detected.
- QC for sequencing reads. A summary of the number of raw reads and their quality. If the reads are of too low quality, the results may be unreliable.
- Trim reads. A summary of the read trimming. If the percentage of reads after trim is low or the average read length after trimming is considerably lower than before trimming, it may be a sign that something is wrong with the sample reads.
- QC for human control genes. A summary of the host reads mapping to the human control genes. The fraction of the regions covered is expected to be more than half, and with relatively high median coverage due to the hybrid capture method used. If not, something may have gone wrong during the sample prep, or the sample was not made with the QIAseq xHYB NTM-ID Panel.
- Sections 5 and 6 contain detection results for the analysis:
- Find best references using read mapping. Contains a summary of how many of the input reads mapped to the hsp65 references vs. the host and how many were unmapped. These are the mapping statistics before refinement of the references, and may not match the number of reads mapped to the reference(s) in the following sections. To see more details of the results prior to refinement, see the "Find best reference report" in the "QC & Reports" folder.
- QC for Mycobacteriaceae mapping (Only if a positive result was detected). Contains the name of the reference(s) detected after refinement of references and mapping statistics for the reads mapped to them. Details about the columns:
- Name. The name of the Mycobacteriaceae species reference detected.
- Reference. The accession number of the reference.
- Mapped reads. The number of reads mapped to the reference.
- Non-specific matches. The number of reads that mapped equally well to multiple positions in the set of detected references.
- Reads in aligned pairs. The number of reads mapped in pairs to the reference.
- Fraction of reference covered. The fraction of the reference covered by at least one read.
- Average coverage. The number of nucleotides mapped to the reference divided by the reference length.