Data QC and Taxonomic Profiling
The Data QC and Taxonomic Profiling template workflow combines the Taxonomic Profiling tool with a trimming step and additionally creates sequencing QC reports. The workflow outputs both a raw and a refined taxonomic profiling abundance table as well as additional reports on the trimming, QC and taxonomic analysis.
To run the workflow, go to:
Workflows | Template Workflows (![]() ) | Microbial Workflows (
) | Microbial Workflows (![]() ) | Metagenomics (
) | Metagenomics (![]() ) | Taxonomic Analysis (
) | Taxonomic Analysis (![]() ) | Data QC and Taxonomic Profiling (
) | Data QC and Taxonomic Profiling (![]() )
)
- Specify the sample(s) or folder(s) of samples you would like to analyze.
- Specify a Trim adapter list if your sequences contain adapters (see Adapter trimming).
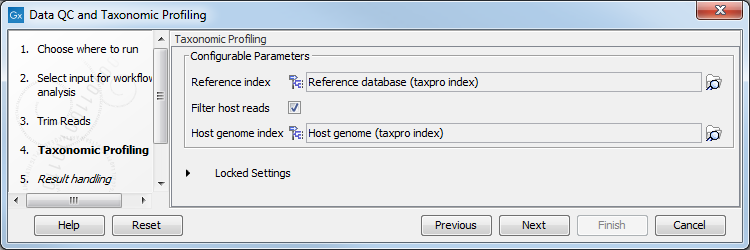
- In the "Taxonomic Profiling" step (figure 2.2), choose the index of references that you wish to map the reads against. You could also remove host DNA by specifying a host genome index (e.g., Homo sapiens GRCh38). Reference databases can be obtained by using the Download Curated Microbial Reference Database tool (Download Curated Microbial Reference Database) or Download Custom Microbial Reference Database tool (Download Custom Microbial Reference Database). For custom reference databases, indexes can be built with the Create Taxonomic Profiling Index tool (Create Taxonomic Profiling Index).
- In the "Create Sample Report" step various summary items have been set. These are guidelines to help evaluate the quality of the results (see Create Sample Report).

Figure 2.2: Specify the reference database. You can also check the option "Filter host reads" and specify the host genome.
The workflow produces the following outputs:
- Raw abundance table. The Taxonomic Profiling abundance table.
- Refined abundance table. The Taxonomic Profiling abundance table after being refined by running it through Refine Abundance Table (Refine Abundance Table). The Refined abundance table has been aggregated on species level and filtered to exclude taxa with relative abundance below 1%. This is the recommended practice for taxonomic profiling in order to avoid drawing wrong conclusions from the results. See more about the other filtering options available at Refine Abundance Table parameters.
- QC & Reports. Folder containing the individual reports generated during the analysis.
- Sample report. The sample report is curated to contain the most important information for analysis interpretation. All full reports are linked throughout the Sample report or can be found in the QC & Reports folder. The Sample report icon will be colored based on whether Summary item thresholds were met. See the "Quality control" section in the sample report for specifics.
The abundance table displays the names of the identified taxa, along with their full taxonomy, the total amount of reads associated with that taxon, and a coverage estimate. The table can be visualized using the Stacked bar charts and stacked area charts function, as well as the Sunburst charts (see Taxonomic profiling abundance table).
The Sample report should be inspected in order to determine whether the quality of the sequencing reads and the analysis results are acceptable.
