Infer Functional Profile
This tool is currently in beta. Feedback on this plugin is welcome - please get in touch by email (ts-bioinformatics@qiagen.com) and let us know how it can be improved.
For OTU abundance tables it is possible to infer an approximate functional profile using the Infer Functional Profile (beta) tool. In order to run this tool you need a PICRUSt2 Multiplication Table [Douglas et al., 2020] which may be imported using the Import PICRUSt2 Multiplication Table (beta) and optionally an EC database that may be downloaded using the Download Ontology Database tool.
To infer a functional profile from an OTU table, go to
Tools | Microbial Genomics Module (![]() ) | Functional Analysis (
) | Functional Analysis (![]() ) | Infer Functional Profile (beta) (
) | Infer Functional Profile (beta) (![]() )
)
In the first wizard (figure 12.18), select the OTU table for which you want to build the functional profile. Note that the OTU table must have OTU sequences.
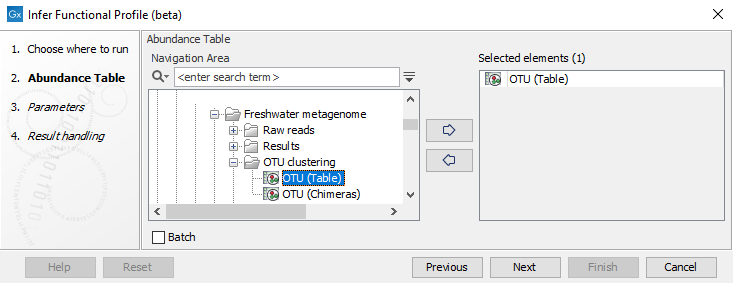
Figure 12.18: Select an OTU abundance table.
In the second step of the wizard (figure 12.19) the terms for which to produce a functional abundance profile can be selected. Note that when selecting to create an EC abundance profile, an additional EC database is required.
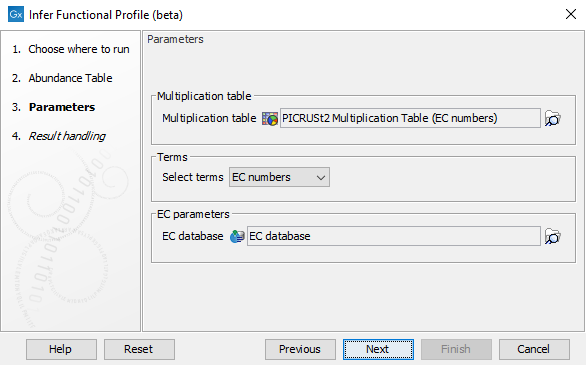
Figure 12.19: Specify the functional terms for which a functional abundance table shall be inferred.
The resulting functional abundance tables store the inferred number of reads corresponding to each of the selected terms in a separate table.
Inference of functional abundances from 16S/ITS data
PICRUSt2 Multiplication Tables can be imported using the Import PICRUSt2 Multiplication Table (beta) tool. The multiplication
tables contain kmer frequency profiles, associated rRNA copy numbers and term multipliers, i.e. how often
a certain functional term is encountered on the genomic sequence of the associated rRNA sequence.
The Infer Functional Profile (beta) algorithm works by comparing kmer frequency profiles for each identified OTU
with the stored kmer frequency profiles in a PICRUSt2 Multiplication Table to find the nearest neighbor
to the OTU under consideration in the Multiplication Table. For this nearest neighbor, both the rRNA copy
number and term multiplication numbers are available. From a single OTU the predicted term multiplicity
is obtained by dividing the read count for the OTU by the identified rRNA copy number and multiplying it
by the identified term multiplication number. To obtain the final inferred term read count, the individual
predictions for all OTUs are summed up per term.
The Infer Functional Profile (beta) algorithm is inspired by two published methods PICRUSt2 [Douglas et al., 2020] and Piphillin [Narayan et al., 2020]. Note that PICRUSt2 [Douglas et al., 2020] and Piphillin [Narayan et al., 2020] do not use kmer frequency profiles but alignments (and for PICRUSt2 optimal tree positioning of a reference) for the identification of the nearest neighbor(s), which typically have a higher precision but are also slower to compute. Typically, it is not expected that high precision is required for the identification of the nearest neighbors as most OTUs are most likely not represented exactly in the database and a close neighbor is typically good enough. While this is true for well-represented species, it has been shown in [Douglas et al., 2020] that only a single nearest neighbor may be a bad predictor for the rRNA and term copy numbers. In this respect we expect the Infer Functional Profile (beta) tool to be comparable to Piphillin [Narayan et al., 2020].