Normalize OTU Table by Copy Number
One way to correct OTU abundance tables is to take the rRNA copy number of the detected species into account and divide the detected read number for each OTU by the rRNA copy number. This can be done with the Normalize OTU Table by Copy Number (beta) tool. Note that this algorithm corrects the species distribution for each sample individually to get a more realistic picture of the species distribution in a sample. In order to normalize OTU abundance tables across samples one can use the Create Normalized Abundance Subtable button (see Visualization of OTU abundance tables), but many tools use an internal cross-sample normalization strategy.
In order to run this tool, an Amplicon Multiplication Table is required. Such tables can be imported with Import PICRUSt2 Multiplication Table (beta).
To run the tool, go to
Tools | Microbial Genomics Module (![]() ) | Metagenomics (
) | Metagenomics (![]() ) | Amplicon-Based Analysis (
) | Amplicon-Based Analysis (![]() ) | Normalize OTU Table by Copy Number (beta) (
) | Normalize OTU Table by Copy Number (beta) (![]() )
)
Select the OTU table you want to normalize first and click "Next".
In the next wizard step (see figure 5.1) you can choose the Amplicon Multiplication Table to use.
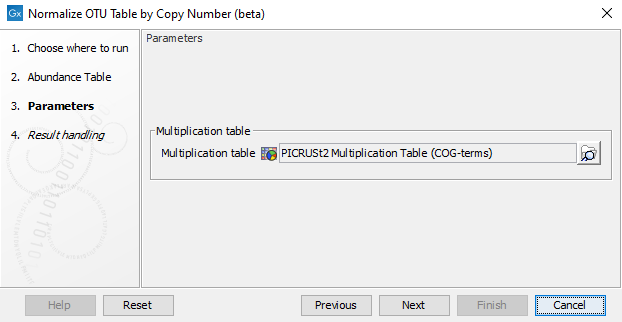
Figure 5.1: Selecting an Amplicon Multiplication Table for normalizing OTU tables.
The normalization works in the same way as the functional inference, except for that the functional inference step is left out, see Inference of functional abundances from 16S/ITS data.