De Novo Assemble Small Genomes output
The tool outputs a list of contigs and an optional summary report:
Contigs
The main assembly output is a sequence list of contigs . This can also be opened in table view.
De Novo Assemble Small Genome report

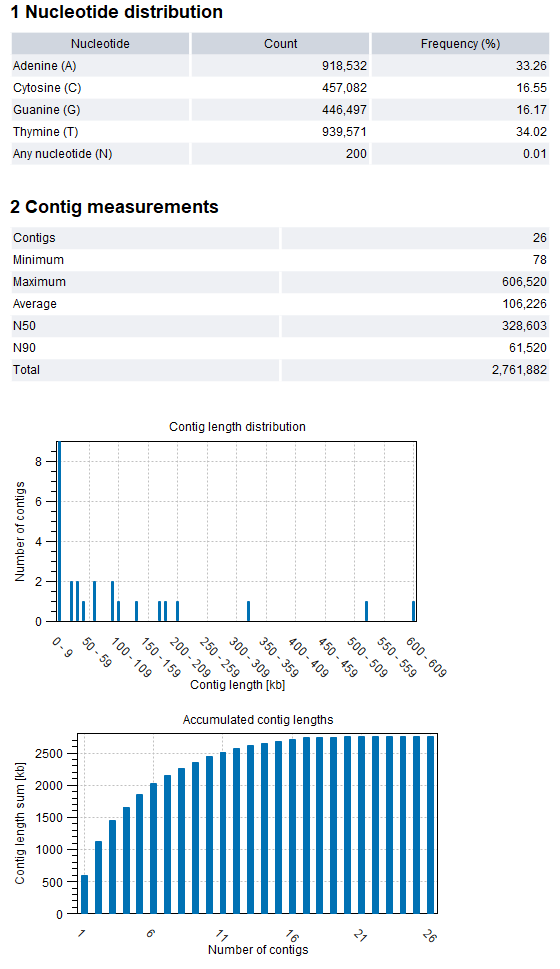
Figure 3.2: De Novo Assemble Small Genome report
The assembly report contains information on the base and length distributions of the contigs. An example of the first sections of the report is shown in figure 3.2.
- Nucleotide distribution.
- Contig measurements. Statistics about the number and lengths of contigs.
- Contigs. The number of contigs.
- Minimum, Maximum, Average. Minimum, maximum and average contig length.
- N50. The length of the shortest contig in sets of contigs of equal length or longer, where the summed length of contigs is at least 50% of the total contig length. As such, N50 is the shortest contig length that must be included to cover 50% of the assembly.
- N90. The length of the shortest contig in a set of contigs of equal length or longer, where the summed length of contigs is at least 90% of the total contig length. As such, N90 is the shortest contig length that must be included to cover 90% of the assembly. N90 will be equal to or smaller than N50.
- Total. The number of bases in the contigs. This can be used for comparison with the estimated genome size to evaluate how much of the genome sequence is included in the assembly.
- Contig length distribution. The number of contigs found at a specific length.
- Accumulated contig length. The y-axis shows the summed contig length, while the x-axis represents the number of contigs, arranged with the largest contigs first. This provides insight into the number of contigs required to cover, for instance, half of the genome.
Evaluating and Refining the Assembly
Three key points to look for in assessing assembly quality are contiguity, completeness, and correctness.
- Contiguity: How many contigs are there?
A high N50 and low number of contigs relative to your expected number of chromosomes are ideal. If you aren't sure what type of N50 and contig number might be reasonable to expect, you could try to get an idea by looking at existing assemblies of a similar genome, should these exist. For an even better sense of what would be reasonable for your data, you could make comparisons to an assembly of a similar genome, assembled using a similar amount and type of data. If your assembly results include a large number of very small contigs, it may be that you set the minimum contig length filter too low. Very small contigs, particularly those of low coverage, can generally be ignored.
- Completeness: How much of the genome is captured in the assembly?
If a total genome length of 5MB is expected based on existing literature or similar genomes that have already been assembled, but the sum of all contig lengths is only 3.5MB, you may wish to try the De Novo Assembly tool, which has tuneable parameters https://resources.qiagenbioinformatics.com/manuals/clcgenomicsworkbench/current/index.php?manual=De_Novo_Assembly.html
Depending on the resources available for the organism you are working on, you might also assess assembly completeness by aligning the assembled contig sequences to a known reference. You can then check for regions of the reference genome that have not been covered by the assembled contigs. Whether this is sensible depends on the sample and reference organisms and what is known about their expected differences.
- Correctness: Do the contigs that have been assembled accurately represent the genome?
One key question in assessing correctness is whether the assembly is contaminated with any foreign organism sequence data. To check this, you could run a BLAST search using your assembled contigs as query sequences against a database containing possible contaminant species data.
In addition to BLAST, checking the coverage can help to identify contaminant sequence data. The coverage of a contaminant contig is often different from the desired organism so you can compare the potential contaminant contigs to the rest of the assembled contigs. To check for these types of coverage differences between contigs you may:
- Map your reads used as input for the de novo assembly to your contigs;
- Create a Detailed Mapping Report;
- In the Result handling step of the wizard, check the option to Create separate table with statistics for each mapping;
- Review the average coverage for each contig in this resulting table.
Assessing the correctness of an assembly also involves making sure the assembler did not join segments of sequences that should not have been joined - or checking for mis-assemblies. This is more difficult. One option for identifying mis-assemblies is to try running the InDels and Structural Variants tool. If this tool identifies structural variation within the assembly, that could indicate an issue that should be investigated.
Post assembly improvements
The CLC Genome Finishing Module has been developed to reduce the extensive workload associated with genome finishing and to facilitate as many steps in the procedure as possible. The module can be downloaded from the Workbench Plugin Manager, or from our website at https://digitalinsights.qiagen.com/plugins/clc-genome-finishing-module/. A free trial license is available, as described at https://resources.qiagenbioinformatics.com/manuals/clcgenomefinishing/current/index.php?manual=Licensing_modules.html.
