OTU clustering outputs
Click Next to select outputs (figure 5.5).
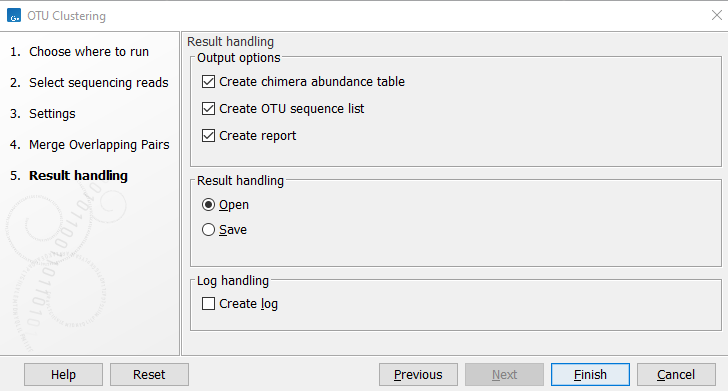
Figure 5.5: OTU Clustering output options
In addition to the OTU abundance table, the following outputs are available:
- A sequence list of the OTUs
- A chimera abundance table with abundances for chimeras in each sample.
- A report that summarizes the results of the OTU clustering. For paired-end data, the report will include a section about the merging of overlapping paired reads.
The OTU report
An example of an OTU report is shown in figure 5.6. The report contains the following sections:
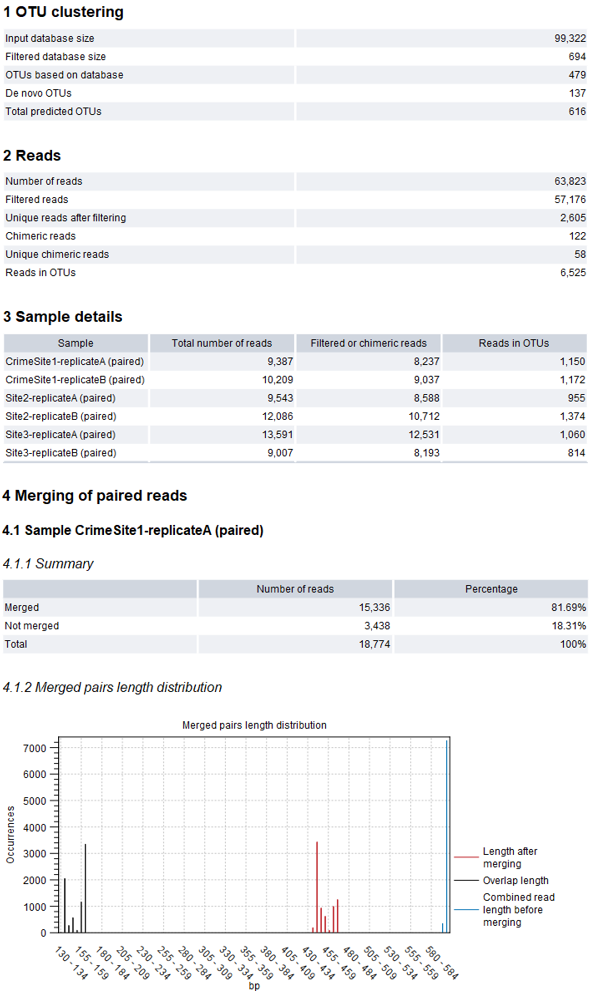
Figure 5.6: Example of report produced by the OTU clustering tool.
- OTU clustering
- Input database size The number of sequences in the input OTU database.
- Filtered database size The number of sequences in the input OTU database having input reads mapped to it.
- OTUs based on database The number of OTUs based on a sequence from the database.
- De novo OTUs The number of OTUs not based on a sequence from the database.
- Total predicted OTUs The total number of OTUs found.
- Reads
- Number of reads The number of input reads
- Filtered reads The number of reads filtered due to the minimum occurrences parameter. When reads are not at a specified similarity distance with the database, and the option to create new OTUs is not selected, these reads will be filtered as well.
- Unique reads after filtering The number of unique reads after filtering. This is the number of candidates for OTUs before clustering.
- Chimeric reads The number of reads detected as chimeric during clustering.
- Unique chimeric reads The number of unique reads detected as chimeric.
- Reads in OTUs The number of reads that contribute to the output OTUs.
- Sample details
- Sample The name of the sample for which the following details are shown.
- Total number of reads The number of input reads from the given sample.
- Filtered or chimeric reads The number of reads from the given sample that were filtered due to the minimum occurrences parameter or detected as chimeric during clustering.
- Reads in OTUs The number of reads from the given sample that contribute to the output OTUs.
- Merging of paired reads the following is reported for each input sample (generated if the input reads were paired)
- Summary The number of merged, not merged and total paired reads.
- Merged pairs length distribution Distribution of the lengths of the read pairs with the length of a read in base pairs on the x-axis and on the y-axis in the number of times a read of a given lengths has been observed.
The OTU abundance table
The OTU abundance table contains a list of OTUs, per-sample abundance values, and total abundance counts. Note that if the input contains paired-end sequences, each pair is counted as one read. There are a number of ways to visualize the contents of an OTU abundance table:
- Table view (
 ) (figure 5.7)
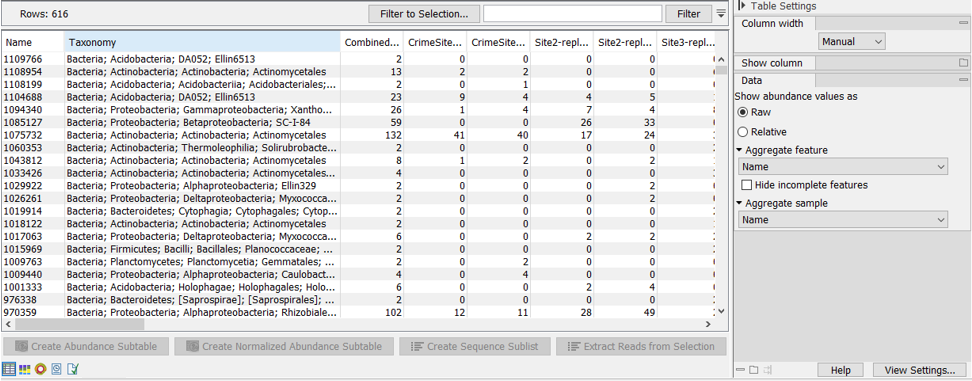
Figure 5.7: OTU abundance table.The table displays the following columns:
- Name The name of the OTU, specified by either the reference database or by the OTU representative (see below for more details).
- Taxonomy The taxonomy of the OTU, as specified by the reference database when a database entry was used as Reference.
- Combined Abundance The total number of reads belonging to the OTU across all samples.
- Min Minimum abundance across all samples
- Max Maximum abundance across all samples
- Mean Mean abundance of all samples
- Median Median abundance of all samples
- Std Standard deviation of all samples
- Abundance for each sample The number of reads belonging to the OTU in a specific sample.
- Sequence The sequence of the centroid of the OTU.
Note on OTU Names: The name is either
- The OTU name in the reference database (e.g. 978664)
- The name of the read used as centroid, which for sequencing data may look like random numbers and letters. If the same name is present more than once, then the OTUs will have a trailing number "-00123" like readName-12345.
- If there is no name (for new clusters where reads have no name), something like OTU-12345 is assigned.
In the right side panel, under the tab Data, you can switch between absolute counts and relative abundances (relative abundances are computed as the ratio between the number of reads belonging to the OTU in a specific sample and the total number of reads in the sample). You can also combine absolute counts and relative abundances by taxonomic levels by selecting the appropriate phylum in the Aggregate feature drop-down menu. Use the option below to Hide samples for which the taxonomy at the aggregated taxonomic level is incomplete. Finally, if you have previously annotated your table with Metadata (see section 7.9), you can Aggregate sample by the groups previously defined in your metadata table. This is useful when analyzing replicates from the same sample origin.
Under the table, the following actions are available:
- Create Abundance Subtable will create a table containing only the selected rows.
- Create Sequence Sublist will create a sequence list containing only the selected rows.
- Create Normalized Abundance Subtable will create a table with all rows normalized on the values of a single selected row. The row used for normalization will disappear from the new abundance table. The normalization scales the abundance table linearly, where the scaling factor is calculated by determining the average abundance across all samples and for each sample scale it to the average for the reference. Note that to be enabled, the selected row for normalization can only have non null abundance values. If you have zero values in some samples for the control, you will need to generate a new abundance table where these samples are not present. If the abundance table is obtained from merging single-sample abundance tables, then the merge should be redone excluding the samples with zero control read counts.
- Stacked visualization view (
 )
)
In the Stacked Bar (figure 5.8) and Stacked Area Charts (figure 5.9), the metadata can be used to aggregate groups of columns (samples) by selecting the relevant metadata category in the right hand side panel. Also, the data can be aggregated at any taxonomy level selected. The relevant data points will automatically be summed accordingly.
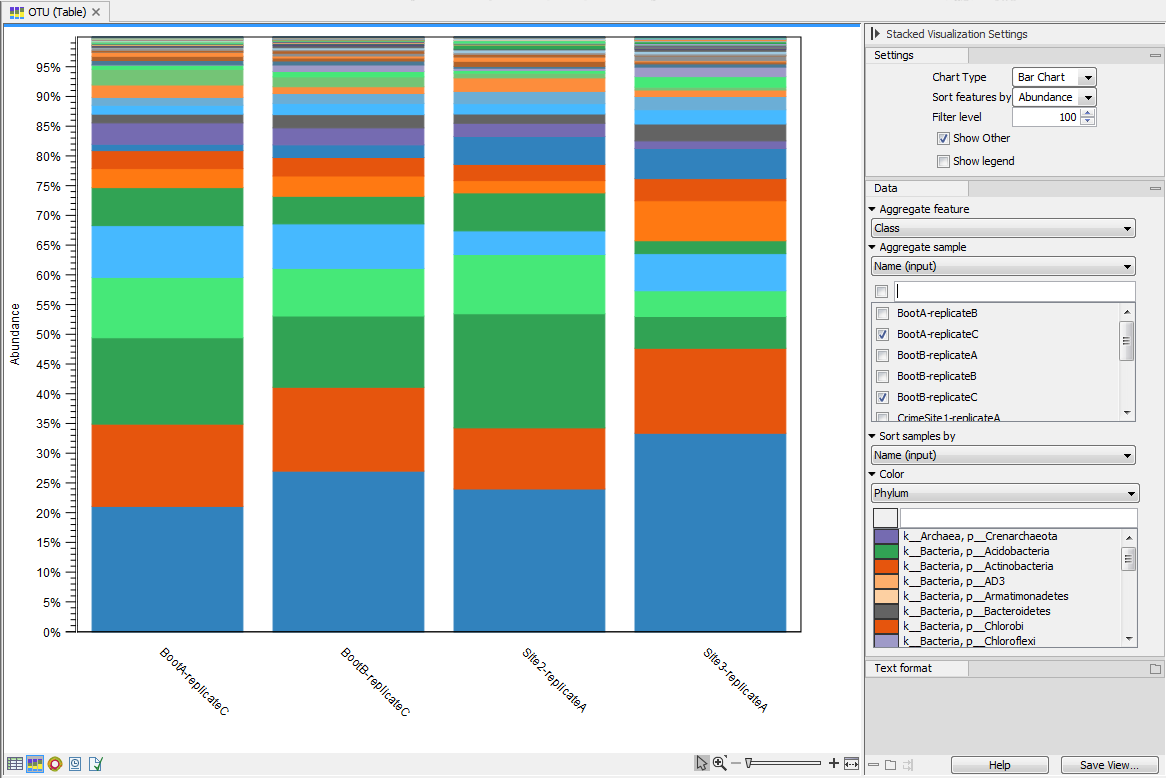
Figure 5.8: Stacked bar of the microbial community at the class level for 4 different samples.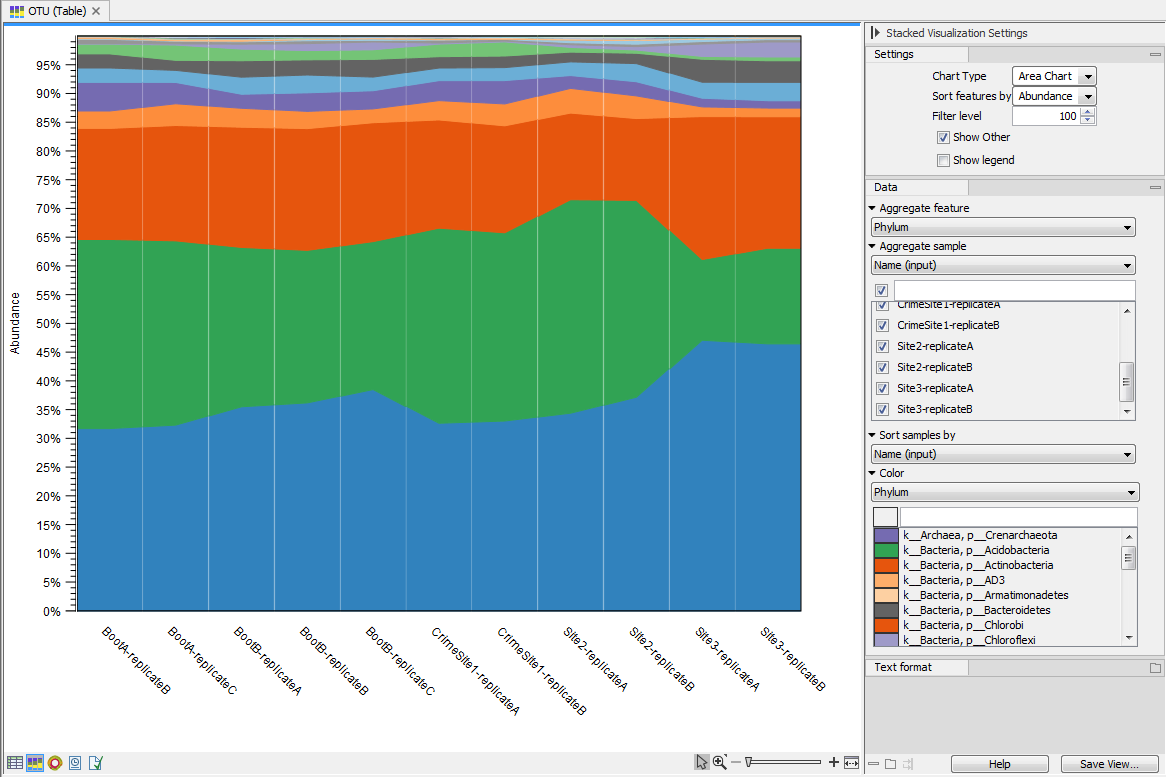
Figure 5.9: Stacked area of the microbial community at the phylum level for 11 different sites.Holding the pointer over a colored area in any of the plots will result in the display of the corresponding taxonomy label and counts. With Filter level you can modify the number of features shown in the plot. For example, setting the value to 10 means that the 10 most abundant features of each sample will be shown in all columns. The remaining features are grouped into "Other", and will be shown if the option is selected in the right hand side panel. One can select which taxonomy level to color, and change the default colors manually. Colors can be be specified at the same taxonomy level as the one used to aggregate the data or at a lower level. When lower taxonomy levels are chosen in the data aggregation field, the color will be inherited in alternating shadings. It is also possible to sort samples by metadata attributes, and to show groups of samples without collapsing their stacks, as well as change the label of each stack or group of stacks. Features can be sorted by "abundance" or "name" using the drop down menu in the right hand side panel. Using the bottom right-most button (Save/restore settings (
 )), the settings can be saved and applied in other plots, allowing visual comparisons across analyses.
- The sunburst view (
 )
)
The zoomable sunburst view lets the user select how many taxonomy level counts to display, and which level to color. Lower levels will inherit the color in alternating shadings. Taxonomy and relative abundances (the ratio between the number of reads belonging to the OTU in a specific sample and the total number of reads in the sample) are displayed in a legend to the left of the plot when hovering over the sunburst viewer with the mouse. The metadata can be used to select which sample or group of samples to show in the sunburst (figure 5.10).
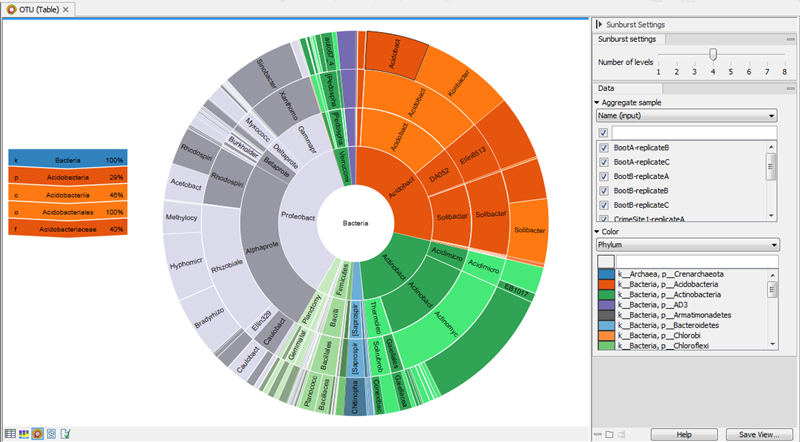
Figure 5.10: Sunburst view of the microbial community showing all taxa belonging to the kingdom bacteria.Clicking on a lower level field will render that field the center of the plot and display lower level counts in a radial view. Clicking on the center field will render the level above the current view the center of the view (figure 5.11).
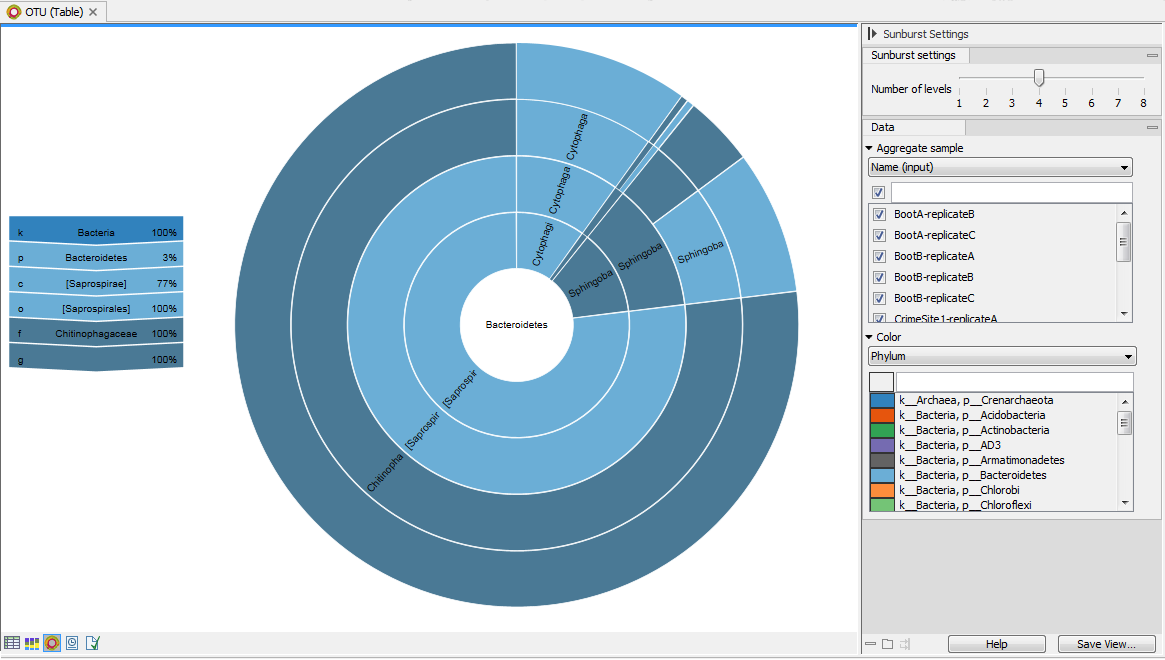
Figure 5.11: Sunburst view of the microbial community zoomed to show all taxa belonging to the phylum Bacteroidetes.