The Viral Integration Viewer
The viral integration viewer presents a graphical view of a virus together with the host genome, shown in a circular plot, see (figure 6.8).
The viral integration viewer is synchronized to the table view: selecting a breakpoint in the table view, will choose the corresponding breakpoint in the graphical view, and vice versa.
The upper left quadrant is a view of the virus. Notice, that if several viruses are detected in a sample, it is possible to choose between them using the Virus drop-down in the sidepanel view.
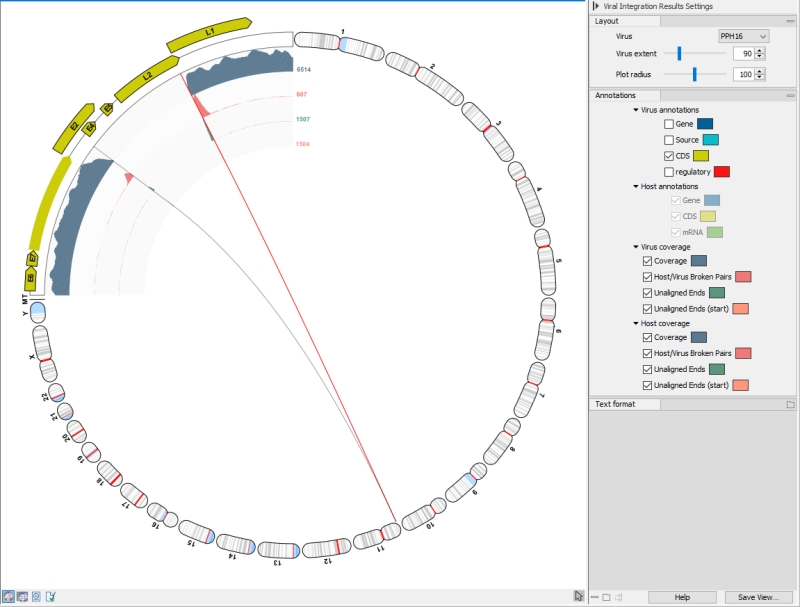
Figure 6.8: The viral integration viewer.
It is possible to zoom in on the host genome, by using the mouse-wheel on a section of the host genome, see (figure 6.9). It is also possible to double-click a breakpoint to zoom in and center on the breakpoint on the host genome.
Most elements (coverages, annotations, genome positions, breakpoints) show tooltips with additional information when hovering them with the mouse.
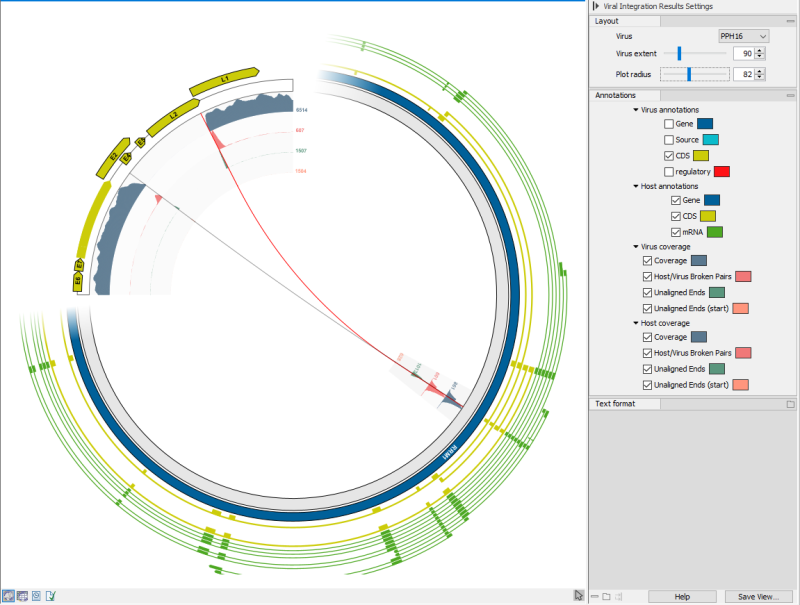
Figure 6.9: The viral integration viewer when zoomed in.
The table view, (figure 6.10), shows summary information for the identified breakpoints, including the host and virus regions, the number of unaligned reads supporting the host and virus end of the breakpoint, and the number of broken host/virus pairs supporting the breakpoint.
The table view also lists any genes that overlap with the breakpoint position. This information is only available if Gene, CDS, or mRNA tracks are provided for the host genome. If CDS and/or mRNA tracks are provided, an additional qualifier ("exon" or "intron") will be added to the output.
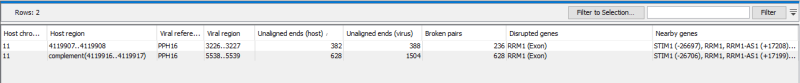
Figure 6.10: The table view for the detected viral breakpoints.