Refine Abundance Table output
The tool outputs an abundance table and an optional report.
Refine Abundance Table report
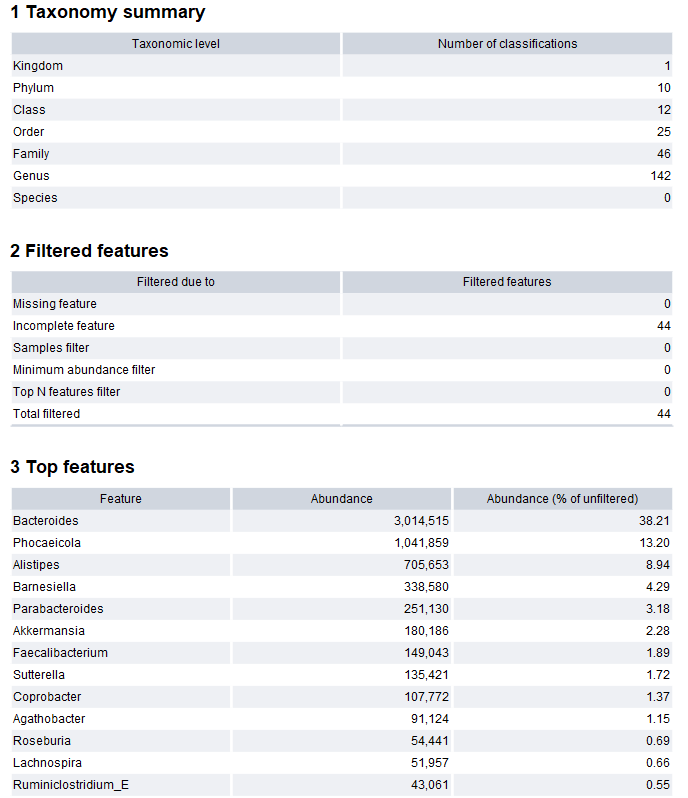
Figure 7.5: The Refine Abundance Table report.
The Refine Abundance Table report (figure 7.5) contains a summary of the number of features at the given taxonomic level in the output table. If aggregation has been performed, the number of features at a taxonomic level more specific than the aggregated level will be zero.
The report also contains a summary of why different features were filtered. When a feature is filtered by multiple filters, it is listed as being filtered by the first of the filters in the table that it failed.
Finally, the report lists the top 50 features in the output table when sorted by abundance. The corresponding abundances are shown both as a raw abundance, and as a percentage of the total abundance of the table after any aggregation and before any filtering.