The Identified Pathways View
When double clicking on a line in the table or selecting one or several lines and clicking on
Open Pathway View in the bottom of the table, a simple visualization of the corresponding
pathway(s) will be opened in a split view (figure 12.23). This visualization is similar
to the pathway view of a pathway database, see The Pathway View.
This object has two views
- The Identified Pathways Graph View (
 )
)
- The Text Contents View (
 )
)
The Identified Pathways Graph View
In this split view, the data from the original (differential) abundance table can be visualized on the EC terms. A minimap in the right upper corner of the side panel simplifies the navigation if many pathways have been opened at the same time. In the Metric section, a specific sample or comparison can be chosen for which the data will be visualized on the EC terms, whereas the Metric drop down menu provides a selection of different metrics associated with the EC terms. For an abundance table, the only option is Abundance whereas for a differential abundance table there are the options- Max group mean
- Log
 fold change
- Fold change
- P-value
- FDR p-value
- Bonferroni
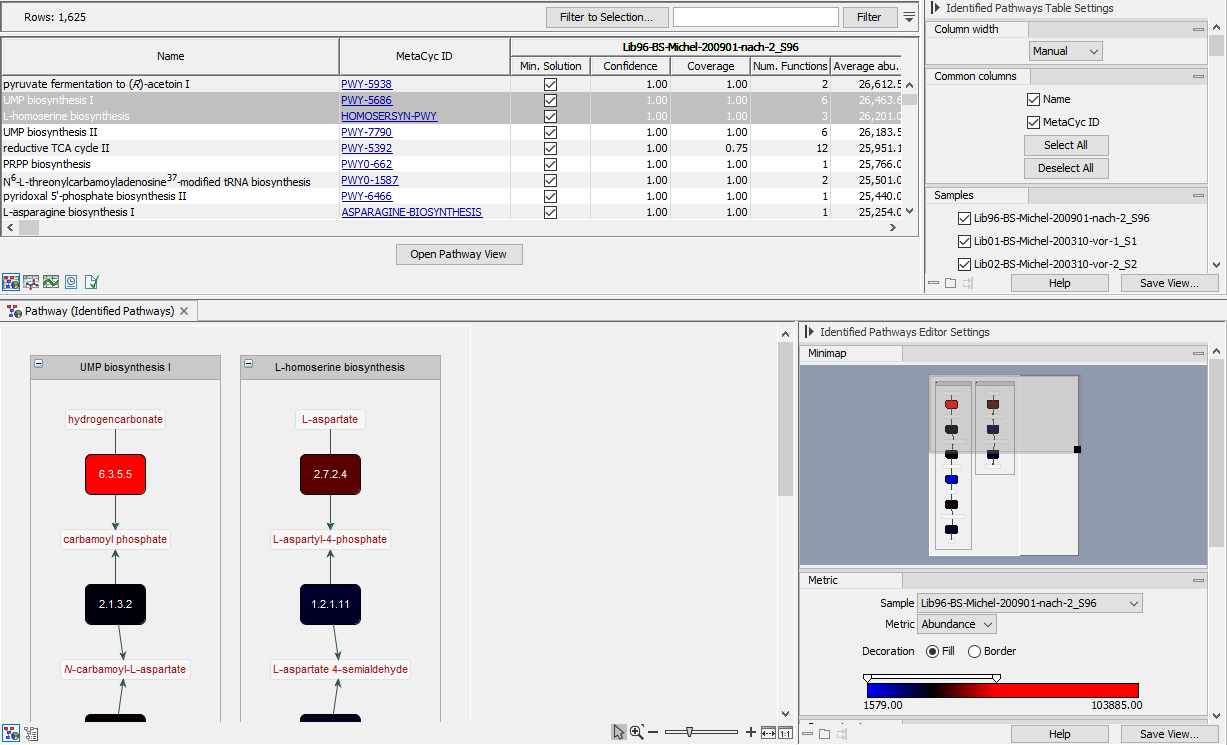
Figure 12.23: A pathway call result from an abundance table, where the abundances from the input table
correspond to the hue of the functional entities in the pathway. The hues or width of the functional terms in the
pathway visualization can be set to any metric from the input (differential) abundance table for a given sample or
comparison.
In the lower right corner of the side panel there is a property viewer which displays information about selected EC terms and metabolites.