SNP tree report
The SNP tree report summarizes the result of the applied filtering.
- Filter status
- Pre-alignment filtering. A summary of positions filtered before alignment and tree construction (figure 9.6).

Figure 9.6: SNP tree report - Pre-alignment filtering section.- Number of different input positions. Unique SNPs (and MNVs, if selected) in the input variant tracks, pre-filtering.
- Pruned. Positions filtered due to the prune distance threshold.
- Coverage filtered. Positions filtered based on the two coverage filters.
- Z-value filtered. Positions filtered based on the minimum Z-value threshold.
- Deletion filtered. Positions deleted as at least one sample has a deletion at this position.
- Number of input positions used. Positions that passed all filtering steps and were included in the SNP tree.
- Post-alignment filtering. A summary of positions filtered after alignment but before tree construction.
- Unlikely positions removed. Positions filtered as they conflict with the tree built from the remaining data. For example, a systematic sequencing or variant-calling error introducing a SNP in many samples would require numerous independent gain and loss events, making it inconsistent with the tree.
- Pre-alignment filtering. A summary of positions filtered before alignment and tree construction (figure 9.6).
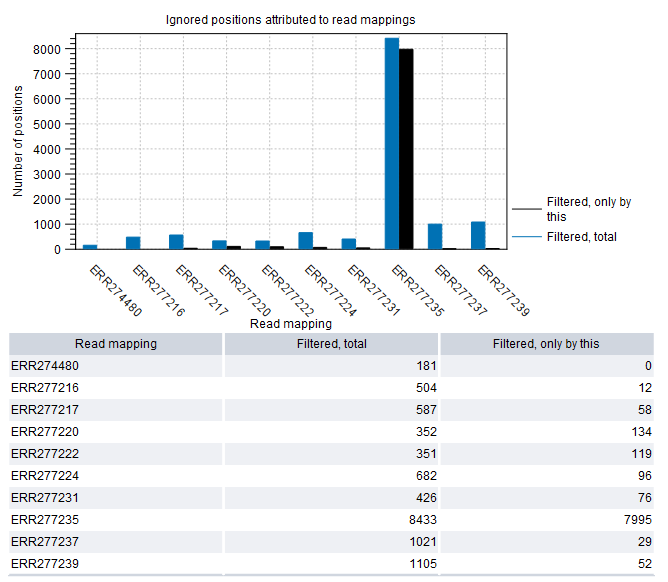
- Ignored positions attributed to read mappings. Information on the number of positions filtered in the individual read mappings (figure 9.7).
- Read mapping. The name of the read mapping.
- Filtered, total. The number of SNPs from this read mapping that were filtered.
- Filtered, only by this. The number of SNPs that were unique to this read mapping, and were filtered.
If one or a few samples have a substantially higher number of filtered positions compared to the rest, one might consider rerunning the tree without these to improve the tree resolution.

Figure 9.7: Visualization of the filter effect across data used for generation of SNP tree. One sample shows a higher number of filtered SNPs and could potentially be omitted from a new SNP tree.
