Find Best Matches using K-mer Spectra
The Find Best Matches using K-mer Spectra tool is inspired by [Hasman et al., 2013] and [Larsen et al., 2014] and enables identification of the best matching reference among a specified reference sequence list.
To identify a best matching bacterial genome reference, go to:
Tools | Microbial Genomics Module (![]() ) | Typing and Epidemiology (
) | Typing and Epidemiology (![]() ) | Find Best Matches using K-mer Spectra (
) | Find Best Matches using K-mer Spectra (![]() )
)
Select the sequences for which you want to find a best match (figure 8.1).
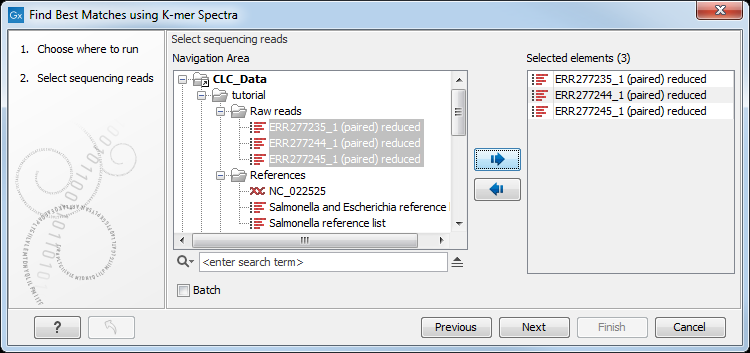
Figure 8.1: To identify a best matching reference, first select the read file(s).
Then specify the following settings (figure 8.2).
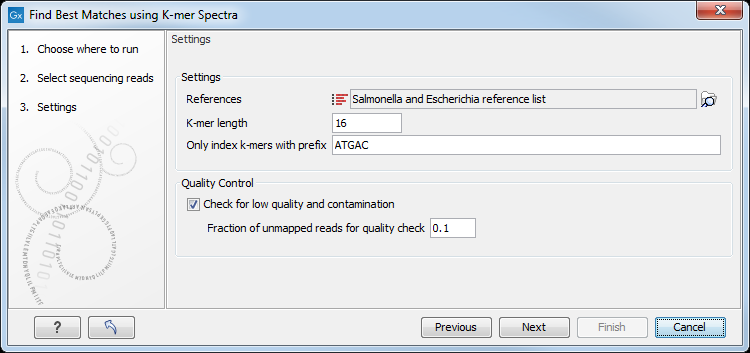
Figure 8.2: Specify the reference list(s) to search across.
- References may be one or more lists of sequences. Sequences with identical entries in the Assembly ID and Latin Name columns are considered as one reference, see Using the Assembly ID annotation. It is, for example, possible to use the full NCBI bacterial genomes database, or subset(s) of it.
- K-mer length is the fixed number (k) of DNA bases to search across. Longer k-mers require more memory, but can distinguish between more closely related references.
- Only index k-mers with prefix allows specification of the initial bases of the k-mer sequence in order to limit the search space. Longer prefixes allow databases to be searched using less memory, but also with lower specificity.
- Check for low quality and contamination. When enabled, a K-mer spectra search will be made for the reads that did not map to the best reference, and those reads will be mapped against this next-best reference. This process will be repeated iteratively until one of the following conditions occurs: 1) 3 additional references, representing likely contaminants have been found, 2) <10% of the remaining unmapped reads map to the next identified best reference, 3) the number of remaining unmapped reads divided by the total number of input reads is less than Fraction of unmapped reads for quality check.
In the last wizard window, the tool provides the following output options (figure 8.3).
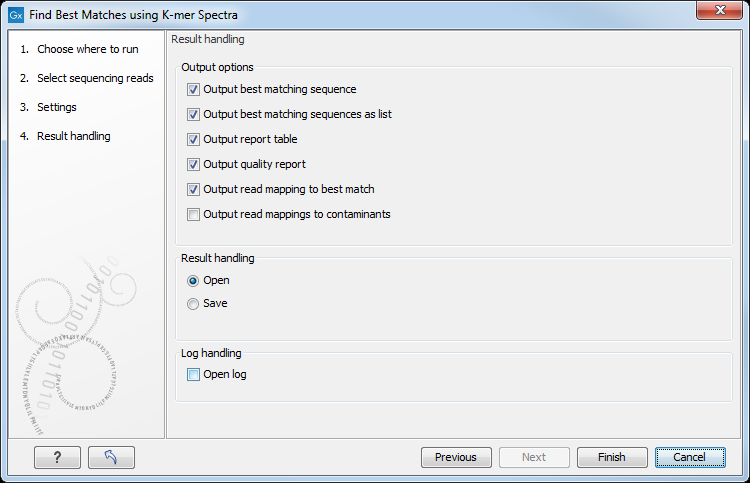
Figure 8.3: Choose your output option before saving your results.
- Output best matching sequence. This list will contain all the sequences in the best matching reference.
- Output best matching sequences as list. Includes the best matching references ordered with the best matching reference first. The list is capped at 100 references. Content is the same as in the Output report table.
- Output report table. Lists the best matching references. The form of the table will differ depending on whether significantly matching references are found.
If significantly matching references are found, a "Winner takes all" strategy is used, which attributes all uniquely found K-mers only to the reference with the highest Z-score. In this case, the table lists all significantly matching references including various statistical values (as described in [Hasman et al., 2013] and [Larsen et al., 2014]). The list is capped at 100 entries. The column headers are:
- Score. Numbers of k-mers from the database seen in the reads.
- Expected. The expected value, i.e., what score would have given a Z-score of 0 and P-value of 1.
- Z. Calculated Z-score.
- P. Z-score translated to two-sided P-value.
- P, corrected. P-value with Bonferroni correction.
If no significantly matching references are found, the table instead lists the single best matching reference, defined as the reference with the greatest number of distinct K-mers seen in the reads. The column headers are:
- Matches. Number of k-mers from the database seen in the reads with the required coverage.
- Input read counts, normalized. Number of k-mers seen in the reads (in both directions) with required coverage, divided by 2 to normalize it to a single direction.
- Coverage required. The calculated required coverage. This is either 5 or the expected coverage given the total length of the reads divided by 2, whichever is higher.
- Output quality report. Creates a report with some statistics based on the mapping of reads to the best identified reference. If Check for low quality and contamination was selected in the first wizard window, then the report contains statistics for up to four identified references. The report also contains the metadata:
- Best match, % mapped. Percent of reads mapping to the best matching reference.
- Contaminating species, % mapped (taxonomy info). Percent of mapping reads and the most specific accessible taxonomy information for the single most probable contaminant. This is only present if Check for low quality and contamination was selected in the first wizard window.
- Output read mapping to best match. The mapping of the reads to the best matching reference.
- Output read mapping to contaminants. If a contamination is detected, this generates the mapping of the reads (which do not map to the best reference) to the probable contaminants. This option is available if the option Check for low quality and contamination was selected in the first wizard window.
In cases where the tool stops with a warning that good references were not found, you should download a new set of references for the organisms of interest and re-run the workflow.
To add the obtained best match to a Result Metadata Table, see Extend Result Metadata Table.
Note that in rare instances, the lists of references found in the Output Best Matching Sequences as a List and Output Quality Report may differ. The reason is that the former list is compiled based on a "Winner takes all" based count of K-mers, which attributes all uniquely found K-mers only to the reference with the highest Z-score. The latter list is produced by removing all reads mapping to the best matching reference and using the remaining reads as a basis for determining the next best match. Thus, in the second round the pool of K-mers has been altered, and some K-mers that determined the Z-score of the original second-best match may have been removed.
Once results from the Find Best Matches using K-mer Spectra tool are added to the Result Metadata Table, extra columns are present in the table, including the taxonomy of the best matching references. In addition, if Check for low quality and contamination was selected, the table will include the percentage of reads mapping to the best reference and the most probable contaminating species (see figure 8.4). If Check for low quality and contamination is not selected, the table will still include the percentage of reads mapping to the best reference if either Output quality report or Output read mapping to best match is selected.

Figure 8.4: Taxonomy of the best matching reference and quality information is shown in the Metadata Result Table.
Subsections