The heat map view
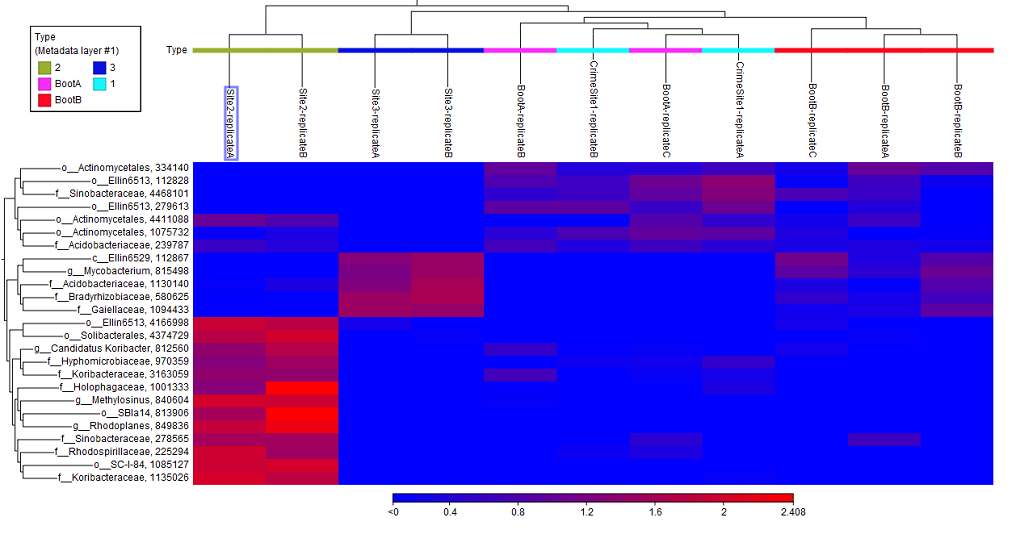
The tool generates a heat map showing the abundance of each feature in each sample and showing the sample clustering and/or feature clustering as a binary tree over the samples and features, respectively (figure 7.20).Each column corresponds to one sample, and each row corresponds to a taxon. Samples and features are hierarchically clustered. Available sample metadata is added as an overlay.
The abundance value of each cell in the heat map is available from the table view (![]() ).
).