PERMANOVA Analysis
PERMANOVA Analysis (PERmutational Multivariate ANalysis Of VAriance, also known as non-parameteric MANOVA [Anderson, 2001]), can be used to measure effect size and significance on beta diversity for a grouping variable. For example, it can be used to show whether OTU abundance profiles of replicate samples taken from different locations vary significantly according to the location or not. The significance is obtained by a permutation test.
To perform a PERMANOVA analysis, go to:
Tools | Microbial Genomics Module (![]() ) | Metagenomics (
) | Metagenomics (![]() ) | Abundance Analysis (
) | Abundance Analysis (![]() ) | PERMANOVA Analysis (
) | PERMANOVA Analysis (![]() )
)
Choose an abundance table with more than one sample as input (e.g., a multi-sample OTU or merged abundance table) and specify the metadata group you would like to test. You will need more than one replicate in the metadata group you select.
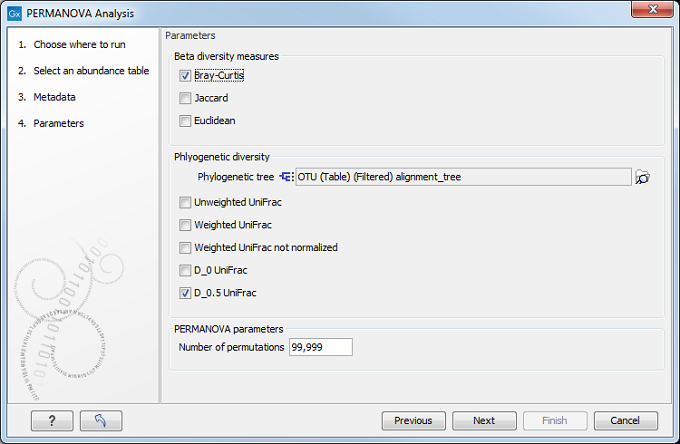
In the "Parameters" dialog (figure 7.15), you can choose which Beta diversity measure to use (see Beta diversity measures). If you are working with OTU abundance tables, you can also specify in the next dialog the phylogenetic tree reconstructed from the alignment of the most abundant OTUs and the phylogenetic diversity measures you wish to use for this analysis. Finally, choose how many permutations should be performed (the default is set to 99,999).

Figure 7.15: Beta diversity and Phylogenetic diversity measures are included in the PERMANOVA analysis.
The output of the analysis is a report which contains two tables for each beta diversity measure used:
- A table showing the metadata variable used, its groups and the results of the test (pseudo-f-statistic and p-value)
- A PERMANOVA analysis for each pair of groups and the results of the test (pseudo-f-statistic and p-value). Bonferroni-corrected p-values (which correct for multiple testing) are also shown.
