Identify Pathways
The Identify Pathways tool takes a functional abundance table with EC terms or a differential abundance table with EC terms as input and translates these into pathway calls using a pathway database. A pathway database can be obtained with the Download Pathway Database tool, see Download Pathway Database. If the input is an abundance table, the called pathways will correspond to all pathways present in the sample. If the input is a differential abundance table, the called pathways are the pathways that have been up or down regulated between two groups of samples.
The algorithm produces a range of solutions for the pathway calls:
- The naive solution where a pathway is called if it contains at least one of the functional terms present in the input table.
- The minimum solution where the smallest set of pathways is chosen such that all terms from the input are present in at least one of the chosen pathways. This is similar to MinPath[Ye and Doak, 2009], only that the algorithm used is based on a greedy minimum set cover strategy and thus only finds an approximate solution to the stated minimization problem.
- The confidence based solution where each pathway is associated with a confidence call based on randomized evaluations of the minimum set cover strategy. In this way, each pathway call is be associated with a confidence for the presence of that pathway. The naive solution and the minimum solution are the outer goal posts, whereas the confidence based solution gives a smooth metric in-between.
To run the Identify Pathways tool go to
Tools | Microbial Genomics Module (![]() ) | Functional Analysis (
) | Functional Analysis (![]() ) | Identify Pathways (
) | Identify Pathways (![]() )
)
Select a functional abundance table or a differential abundance table with EC terms as input and click "Next".
In the Pathway database section of the second step of the wizard (figure 12.20), select the required pathway database. A taxonomic range filter for the called pathways can be set to reduce the amount of false positive pathway calls in the case where the metagenomic reads are known to be of a certain type of origin. For example, if the (differential) abundance table has been produced from an OTU table based on ITS regions using Infer Functional Profile (beta), then the taxonomic range would have to be set to Fungi. Per default the filter is set to Disabled as is appropriate for many whole metagenome and metatranscriptome experiments. Finally, you can choose to include super-pathways in the analysis. This will have an influence on the minimum solution and the confidence scores as super-pathways are constructed of smaller pathways occurring in the pathway database. Since super pathways usually contain a lot of terms, it is more likely that a super-pathway is part of the minimum solution. Also, the super-pathway will tend to have a higher confidence at the cost of a lower confidence for the individual pathways it is composed of
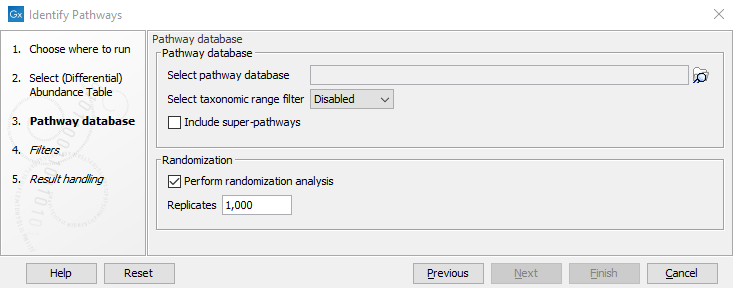
Figure 12.20: Select the pathway database, taxonomic range and set the randomization parameters.
In the Randomization section of the second wizard step (figure 12.20) it is possible to control the randomization experiment for setting the confidence scores. If Perform randomization analysis is selected, the order of pathways in the naive solution is shuffled and the pathways are called sequentially while removing their functional terms until no pathways or no functional terms are left. The number set for Replicates thereby controls how often this is executed and the confidence score becomes the fraction of randomizations in which a pathway is part of the solution. If the setting is deselected an estimate for this number will be given as the confidence of a pathway being present.
In the third wizard step (figure 12.21) it is possible to remove EC terms from the analysis based on the input table.
If the input table is an abundance table, the Abundance table filter section will be relevant. When selecting Ignore terms with a low abundance value, EC terms with abundance values below the value given in Abundance threshold will be ignored in the pathway calling procedure.
If the input table is a differential abundance table, several filters may be applied, one for each column for a statistical comparison in the differential abundance table. Note that some filters remove EC terms with values lower than the specified value in the corresponding field, i.e.
- Max Group Mean
- Absolute fold change
- Absolute log fold change
- P-value
- FDR corrected p-value
- Bonferroni corrected p-value
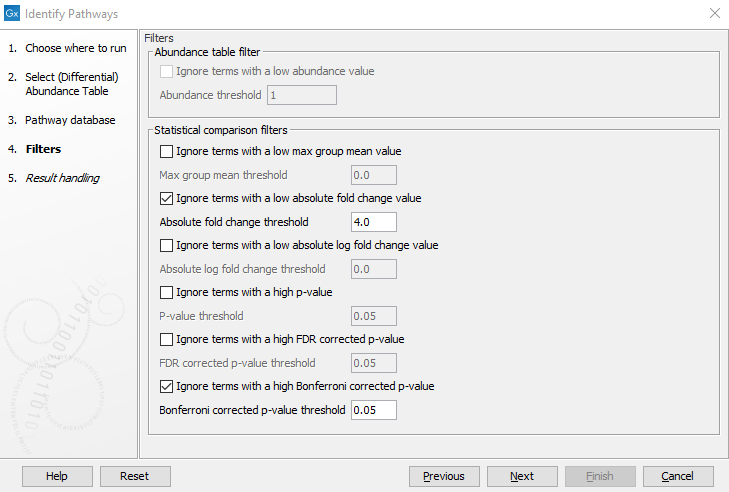
Figure 12.21: Filter the EC terms based on entries in the abundance table (Abundance table filter) or differential abundance table (Statistical Comparison filter) here shown for a differential abundance table.
Subsections