Refine Abundance Table parameters
To run the Refine Abundance Table tool, go to:
Tools | Microbial Genomics Module (![]() ) | Metagenomics (
) | Metagenomics (![]() ) | Abundance Analysis (
) | Abundance Analysis (![]() ) | Refine Abundance Table (
) | Refine Abundance Table (![]() )
)
Select the abundance table to be aggregated or filtered (figure 7.2). Both single and multi-sample abundance tables are supported.
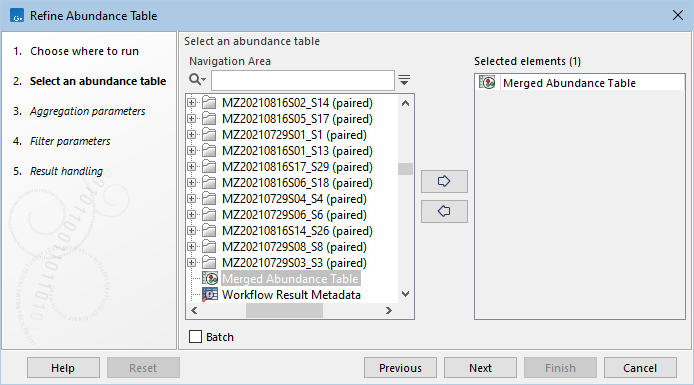
Figure 7.2: Select an abundance table as input.
Click on Next to set aggregation level.
This tool detects the taxonomy from the input and populates the Aggregation level dropdown accordingly (figure 7.3). To perform no aggregation, choose "Do not aggregate" in the dropdown.
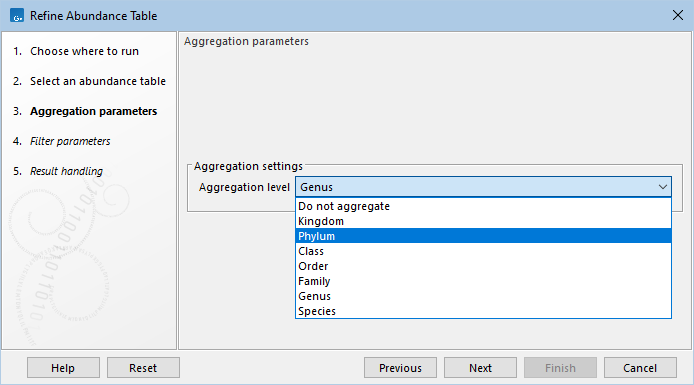
Figure 7.3: The Aggregation level dropdown is populated based on input taxonomy.
When running in a workflow, a taxonomy must be selected that matches the taxonomy of the input abundance table. If the desired taxonomy is not provided in the dropdown, it is possible to choose a Custom Taxonomy and enter the level as free text.
Three types of filters can be applied after aggregation (figure 7.4):
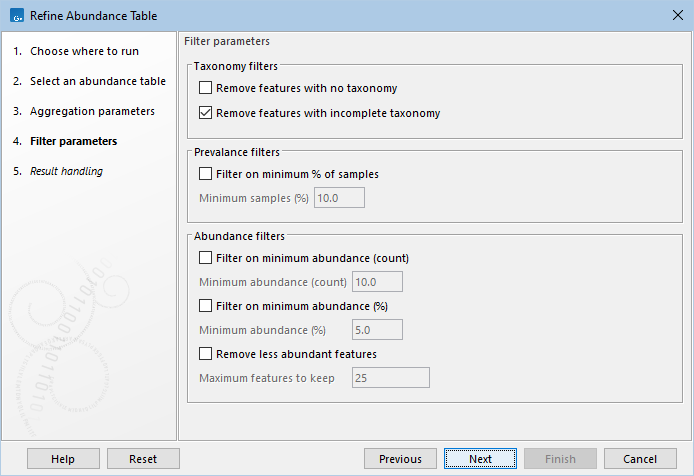
Figure 7.4: Filter features based on taxonomy, prevalence and abundance.
- Taxonomy filters
- Remove features with no taxonomy. Remove features with no taxonomic information. Examples might include de novo OTUs, ASVs, or results from the Build Functional Profile tool.
- Remove features with incomplete taxonomy. Remove features where the most specific term in the taxonomy after aggregation is undefined. For example, if a table is aggregated at Phylum level, features that lack a Phylum indication will be removed by this filter.
- Prevalence filters
These filters are designed to remove rows from tables that contain a large number of samples, where the presence of the row would otherwise tend to give a false positive call of differential abundance. The filter is independent of the test statistic [Nearing et al., 2022].
- Filter on minimum % of samples. Remove features with non-zero abundance in less than the given percentage of samples.
- Minimum samples (%). Only keep rows that have non-zero abundance in greater than or equal to this percentage of samples (after rounding up to the nearest whole number). For example, if there are up to 10 samples, and this is set to 10%, then at least 1 sample must have non-zero abundance. For 11-20 samples and 10%, then at least 2 samples must have non-zero abundance. Be careful to set this value such that:
- It corresponds to at most the size of the smallest group of samples (a group being samples with similar abundance profile) as otherwise rows that are specifically present in that group will be removed. For example, if you set the percentage so that it corresponds to 4 samples, and your setup has groups A, B, and C of sizes groupA: 3, groupB: 4, groupC: 4, the filter will remove rows that have non-zero abundance in only groupA.
- It is sufficiently large to have an effect. For example, with 6 samples, the default value of 10% will not have an effect. To remove rows that have non-zero abundance in at least two samples, one might set the value to 20% (20% of 6 is 1.2, which is rounded up to 2 samples).
- Abundance filters
- Filter on minimum abundance (count). Remove features whose combined abundance is less than a given value.
- Minimum abundance (count). The minimum combined abundance to keep.
- Filter on minimum abundance (%). Remove features whose combined abundance is less than a given percentage of the total abundance of all the features in the table.
- Minimum abundance (%). The minimum percentage to keep. Note that e.g. if the percentage is set to 1.0%, then at most 100 rows can be returned.
- Remove less abundant features. Features are sorted by combined abundance. Only a fixed number of rows of the sorted table will be kept by this filter.
- Maximum features to keep. The fixed number of rows that may pass the filter. Note that, because all filters are applied independently of each other, the output abundance table may have fewer rows than this, because another filter has removed rows.
When filtering, note that the Differential Abundance Analysis tool (see Differential Abundance Analysis), assumes that rows with similar abundance will have similar parameters, and uses this to improve parameter estimates by sharing information across rows. Therefore differential abundance results for aggressively filtered tables may not be as sensitive or precise as results for tables that contain more rows.