Spoligotype Mycobacterium Tuberculosis output
The tool outputs a report with the typing results. An example report can be seen in figure 11.2.
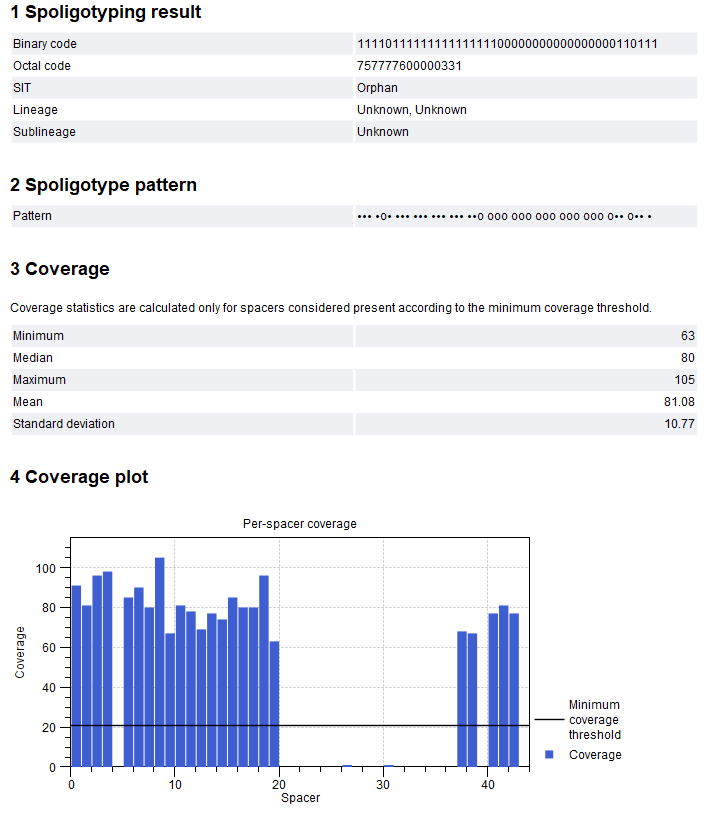
Figure 11.2: Spoligotype Mycobacterium Tuberculosis report.
- Spoligotyping result. This section contains the SpolLineages results based on the spoligotype. Five outputs are reported:
- Binary code. 43 digit binary code, where each spacer is represented as present (1) or absent (0).
- Octal code. 15 digit octal code calculated from the binary code (pattern of triplet of spacers represented as 0-7).
- SIT. Shared International Type of the sample.
- Lineage. The main spoligotype name followed by lineage name and, when available, associated lineage number.
- Sublineage. The spoligotype.
- Spoligotype pattern. This section contains a visual representation of the 43 spacers. Spacers present in the sample are represented by 'n's, while 'o's represent the absence of spacers. When combining spoligotyping reports from multiple samples with the Combine Reports tool, the difference in pattern between samples can be easily visualized, see figure 11.3.
- Coverage. Coverage statistics for the detected spacers i.e., calculated from the spacers considered present in the sample. Counts are given as the number of times a spacer sequence was detected.
- Coverage plot. Bar plot showing the coverage for each spacer. The minimum coverage threshold set when running the tool is visualized as a horizontal line across the plot.
The coverage statistics and plot can be useful to evaluate whether the minimum coverage threshold should be adjusted.
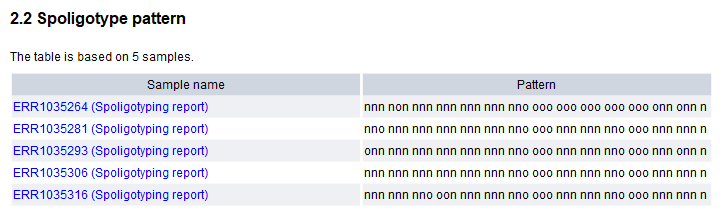
Figure 11.3: Spoligotype patterns from several Mycobacterium tuberculosis samples combined using Combine Reports.