De Novo Assemble Metagenome output
The tool outputs a list of contigs and an optional assembly report.
Contigs
The main assembly output is a sequence list of contigs. This can also be opened in table view.
If Perform scaffolding was selected, scaffolds will appear at the bottom of the contig list as scaffold_1, scaffold_2, etc.
De Novo Assemble Metagenome assembly report
The assembly summary report contains statistics on reads and contigs (figure 4.2).
- Basic statistics on input reads.
- Distribution of nucleotide reads.
- Distribution of read lengths.
- Basic statistics on contigs. This section includes statistics about the number and lengths of contigs.
- Number of contigs.
- Number of contigs > 1kb.
- Total length of contigs.
- Total length of contigs > 1kb.
- Minimum, maximum, mean, and median contig length.
- N10, N25, N50, N75 and N90. The N25 contig set is calculated by adding up the lengths of the biggest contigs until you reach 25 % of the total contig length. The minimum contig length in this set is the number that is usually used to report the N25 value of a de novo assembly. Likewise for the remaining N values.
- Number of Ns per 100kb.
- Distribution of nucleotides in contigs.
- Contig length distribution. The number of contigs found at a specific length.
- Accumulated contig reads. This shows the summed up contig length on the y axis and the number of contigs on the x axis, with the biggest contigs ranked first. This answers the question: how many contigs are needed to cover e.g., half of the genome.
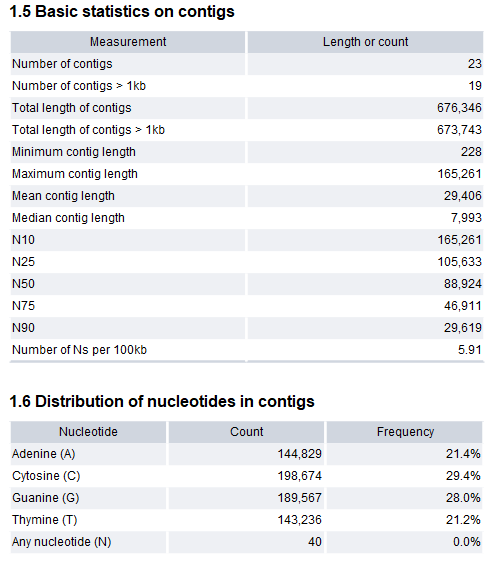
Figure 4.1: The De Novo Assemble Metagenome report, selected sections.