Compare MLST Typing Results output
The tool produces an MLST Comparison output consisting of three views: a minimum spanning tree (MST), a heat map, and a distance matrix table. These views provide complementary representations of allelic distance between samples and sequence types.
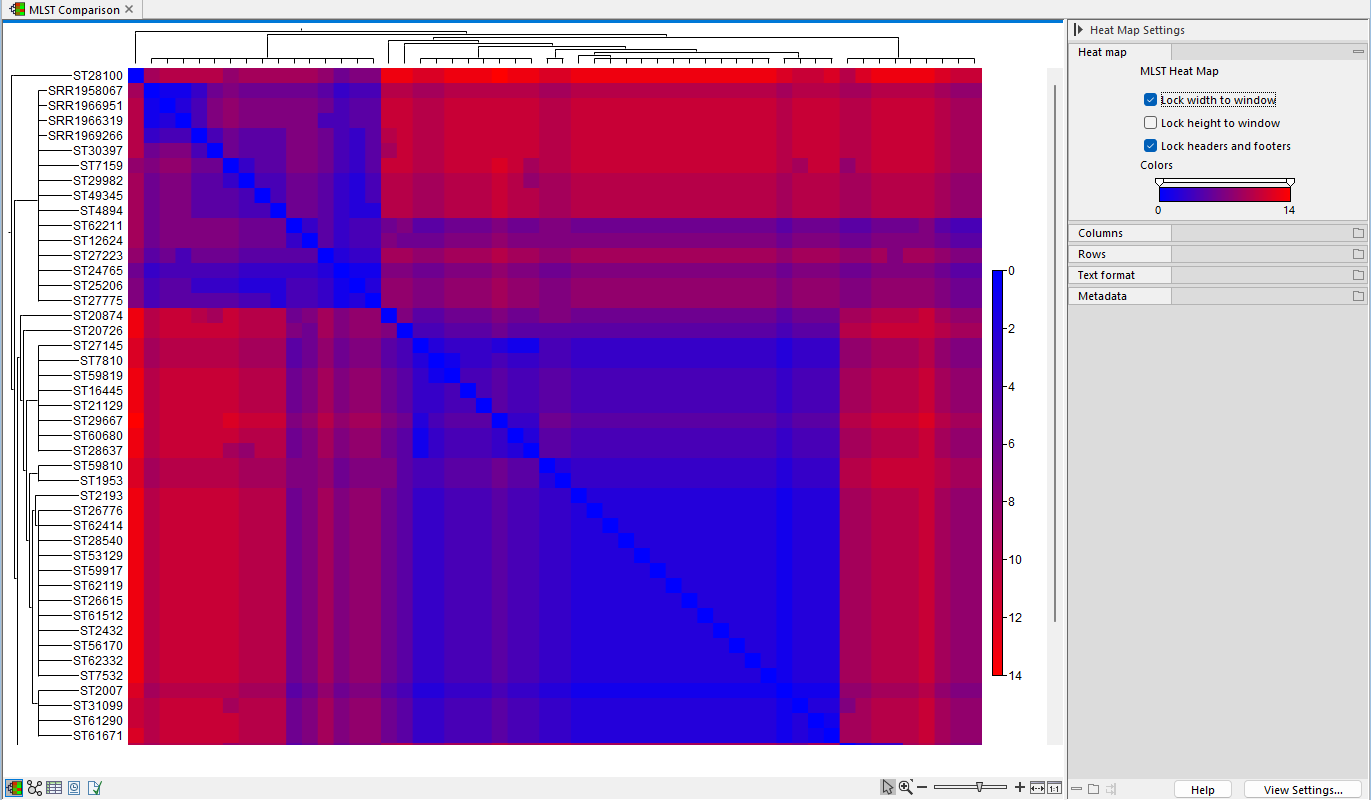
Figure 10.18: MLST Comparison heat map.
The distance matrix is presented as a square table that contains allelic distances between all input samples and included sequence types. This matrix serves as the basis for constructing both the MST and the heat map.
The MST functions as the one available in MLST Schemes. For more, see Minimum Spanning Trees.
The heat map offers a graphical representation of the distance matrix using a color gradient. The heat map includes a hierarchical tree generated through single-linkage clustering, which arranges rows according to similarity (figure 10.18). The Side Panel offers various settings to customize the labels, the tree, the color gradient and more. It can be seen on the right-hand side of the Heat Map view.