Output from the Identify Known Variants in One Sample
The "Identify Known Variants in One Sample" tool produces seven different output types:
- Read Mapping (
 ) The mapped sequencing reads. The reads are shown in different colors depending on their orientation, whether they are single reads or paired reads, and whether they map unambiguously. For the color codes please see the description of sequence colors in the CLC Genomics Workbench manual that can be found here: http://www.clcsupport.com/clcgenomicsworkbench/current/index.php?manual=View_settings_in_Side_Panel.html.
- Target Regions Coverage (
 ) A track showing the targeted regions. The table view provides information about the targeted regions such as target region length, coverage, regions without coverage, and GC content.
- Target Regions Coverage Report (
 ) The report consists of a number of tables and graphs that in different ways show e.g. the number, length, and coverage of the target regions and provides information about the read count per GC%.
- Overview Variants Detected (
 ) Annotation track showing the known variants. The table view provides information about the known variants. Four columns starting with the sample name and followed by "Read Mapping coverage", "Read Mapping detection", "Read Mapping frequency", and "Read Mapping zygosity" provides the overview of whether or not the known variants have been detected in the sequencing reads.
- Variants Detected in Detail () Annotation track showing the known variants. Like the "Overview Variants Detected" table, this table provides information about the known variants. The difference between the two tables is that the "Variants Detected in Detail" table includes detailed information about the most frequent alternative allele (MFAA).
- Genome Browser View Identify Known Variants (
 ) A collection of tracks presented together. Shows the annotated variants track together with the human reference sequence, genes, transcripts, coding regions, target regions coverage, the mapped reads, the overview of the detected variants, and the variants detected in detail.
- Log (
 ) A log of the workflow execution.
It is a good idea to start looking at the Target Regions Coverage Report to see whether the coverage is sufficient in the regions of interest (e.g. > 30 ). Please also check that at least 90% of the reads are mapped to the human reference sequence. In case of a targeted experiment, we also recommend that you check that the majority of the reads are mapping to the targeted region.
When you have inspected the target regions coverage report you can open the Genome Browser View Identify Known Variants file (see 14.44).
The Genome Browser View includes an overview track of the known variants and a detailed result track presented in the context of the human reference sequence, genes, transcripts, coding regions, targeted regions, mapped sequencing reads, and clinically relevant variants in the COSMIC databases.
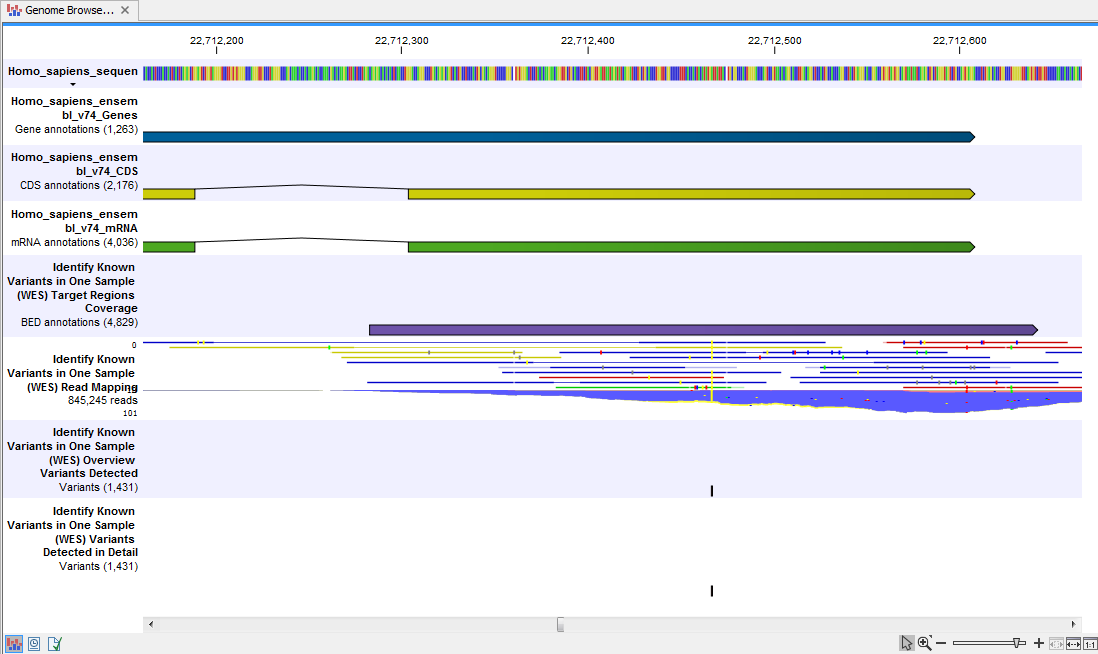
Figure 14.44: Genome Browser View that allows inspection of the identified variants in
the context of the human genome and external databases.
Finally, a track with conservation scores has been added to be able to see the level of nucleotide conservation (from a multiple alignment with many vertebrates) in the region around each variant.
The difference between the overview variant track and the detailed variant track is the annotations added to the variants.
By double clicking on one of the annotated variant tracks in the Genome Browser View, a table will be shown that includes all variants and the added information/annotations (see 14.45).
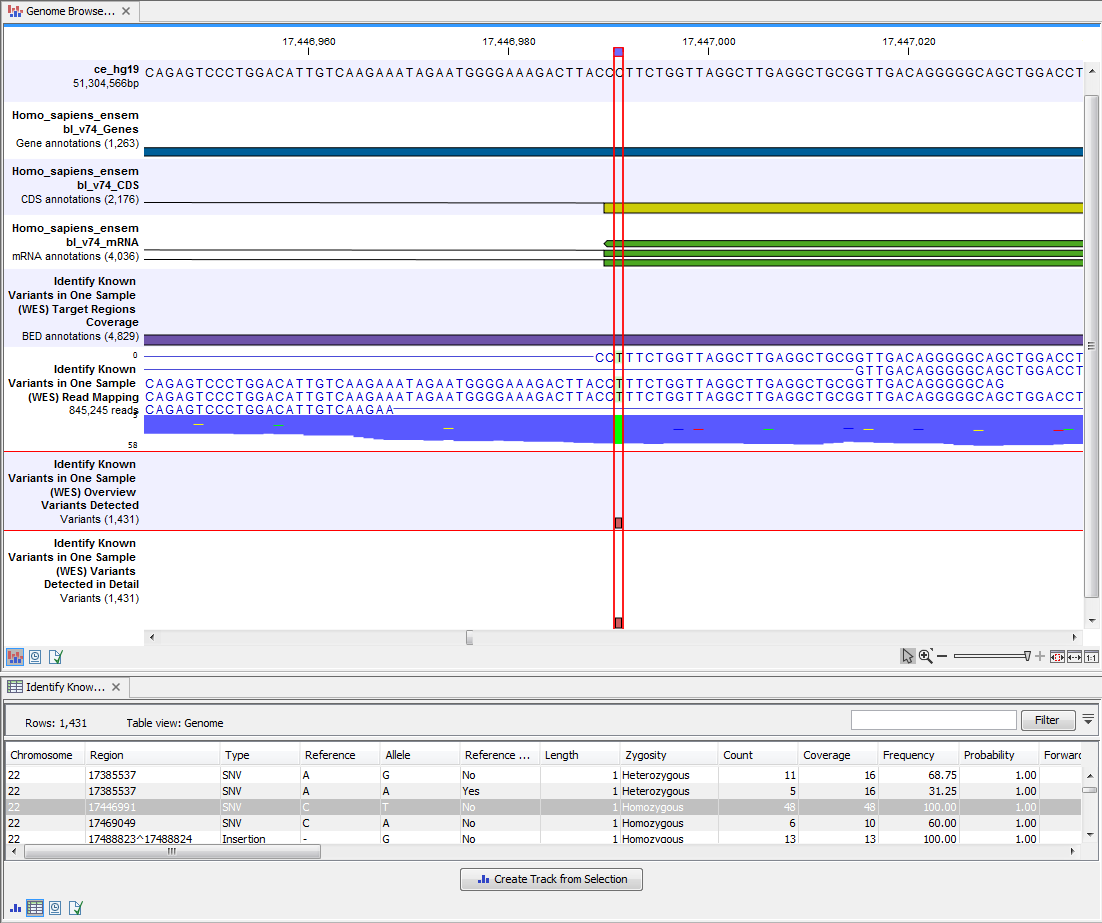
Figure 14.45: Genome Browser View with an open overview
variant track with information about if the variant has been detected or not,
the identified zygosity, if the coverage was sufficient at this position and
the observed allele frequency.
Note We do not recommend that any of the produced files are deleted individually as some of them are linked to other outputs. Please always delete all of them at the same time.