From Tracks to Experiments
When carrying out RNA-seq analysis using the RNA-Seq Analysis tool, the starting point is a set of reads from a sequencing study. As part of the RNA-Seq Analysis tool, these reads are mapped onto a reference genome. The RNA-Seq tool produces expression tracks, which are compatible with the reference genome, and can be visualized together with the genome in the
Genome Browser View (see Genome Browser Tools).
You can find more information about the RNA-Seq Analysis tool in RNA-Seq Analysis).
Once expression tracks have been obtained from the RNA-Seq Analysis tool, they can be used as sequencing-based sets of expression values in setting up an experiment. This can be done using the Set up Experiment tool, also found in the Transcriptomics toolbox. This is described in more detail in Experiments.
An experiment set up in this manner from expression tracks is intimately coupled to the tracks it originated from. To see this coupling in action, perform the following steps:
- Use the Set up Experiment tool on two or more expression tracks to set up an experiment, as described in Experiments.
- Save and open the resulting experiment, by double-clicking its name in the Navigation Area.
- Use the Create New Genome Browser View tool to create a new Genome Browser View from the expression tracks you used to set up the experiment, as described in Genome Browser Tools.
- Save and open the resulting Genome Browser View by double-clicking its name in the Navigation Area.
- Drag the experiment tab downwards, until you see the blue shadow indicating the resulting placement (figure 28.53), and drop it in place. You should now have a divided view, with the experiment in the bottom half (figure 28.54).
- Clicking on any line in the experiment will now automatically jump to the corresponding genomic location in the upper view. Use the Zoom to Selection (
 ) button to zoom in to the desired genomic region.
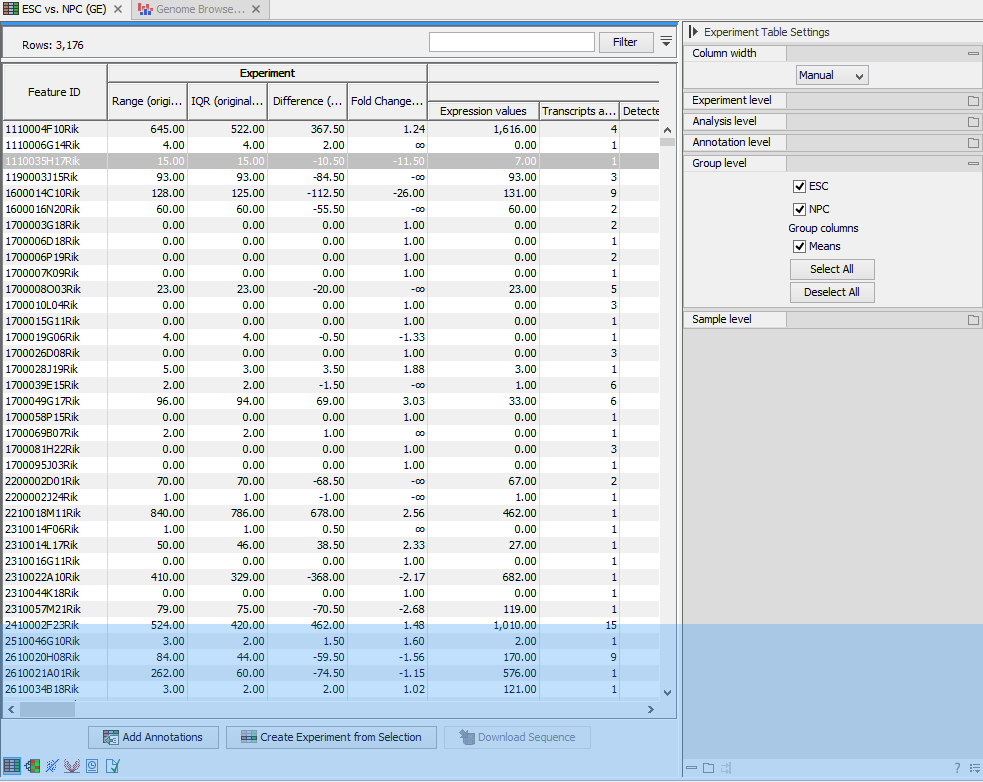
Figure 28.53: Dragging a tab to the lower half of the view area.
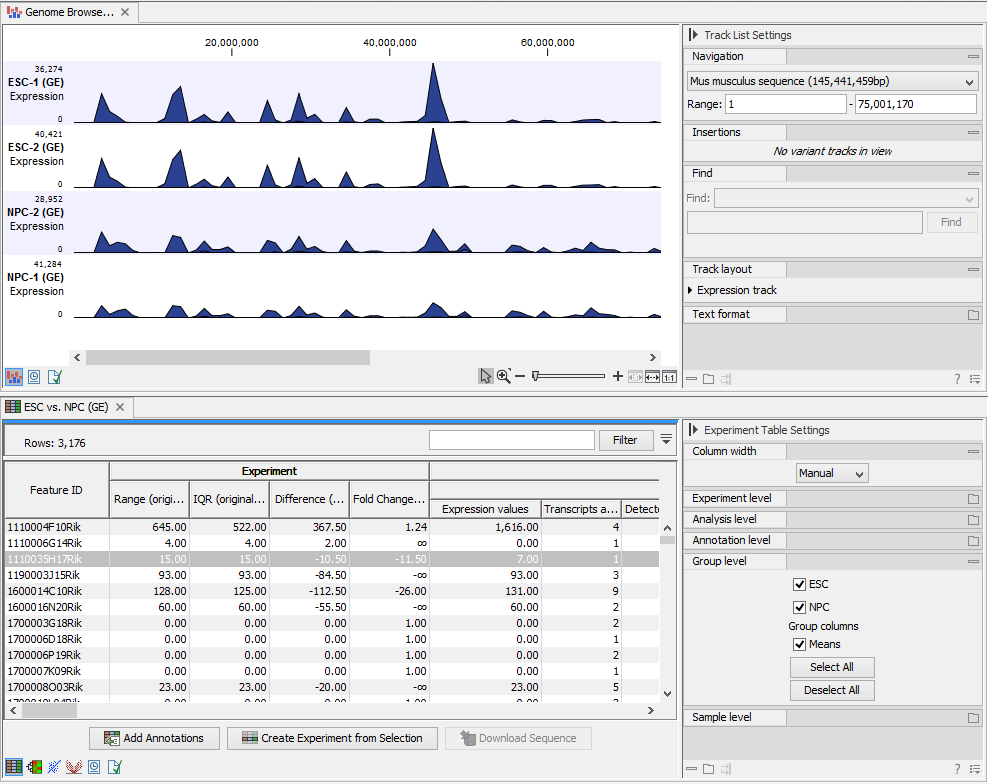
Figure 28.54: After dropping a tab to the lower half othe view area.