Report contents
The sections below describe the contents of the report. Note that the two terms "per-sequence" and "per-base" are used frequently in the following descriptions. The generated report is divided into per-sequence and per-base sections. In per-sequence assessments some characteristic (a single value) is assessed for each sequence and then contributes to the overall assessment. In per-base assessments each base position is examined and counted independently.The report comes in two different flavors: a supplementary report consisting of tables representing all the values that are calculated, and a main summary reports where the tables are visualized in plots (see an example in figure 19.10). Both reports can be exported as pdf files or Excel spread sheets.
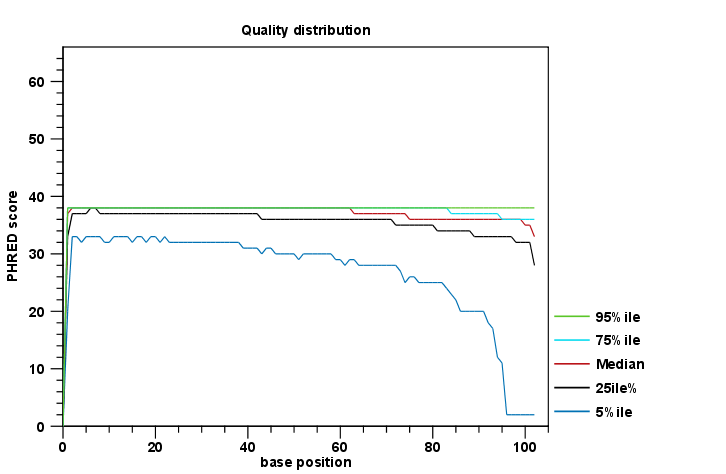
Figure 19.10: An example of a plot from the graphical report, showing the quality values per base position.
Subsections