Corrected p-values
Clicking Next will display a dialog as shown in figure 28.85.
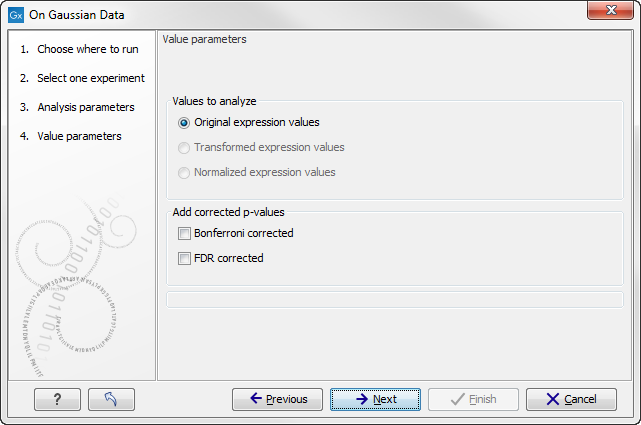
Figure 28.85: Additional settings for the statistical analysis.
At the top, you can select which values to analyze (see Selecting transformed and normalized values for analysis).
Below you can select to add two kinds of corrected p-values to the analysis (in addition to the standard p-value produced for the test statistic):
- Bonferroni corrected.
- FDR corrected.
The Bonferroni corrected p-values handle the multiple testing problem by controlling the 'family-wise error rate': the probability of making at least one false positive call. They are calculated by multiplying the original p-values by the number of tests performed. The probability of having at least one false positive among the set of features with Bonferroni corrected p-values below 0.05, is less than 5%. The Bonferroni correction is conservative: there may be many genes that are differentially expressed among the genes with Bonferroni corrected p-values above 0.05, that will be missed if this correction is applied.
Instead of controlling the family-wise error rate we can control the false discovery rate: FDR. The false discovery rate is the proportion of false positives among all those declared positive. We expect 5 % of the features with FDR corrected p-values below 0.05 to be false positive. There are many methods for controlling the FDR - the method used in CLC Cancer Research Workbench is that of [Benjamini and Hochberg, 1995].
Click Next if you wish to adjust how to handle the results. If not, click Finish.
Note that if you have already performed statistical analysis on the same values, the existing one will be overwritten.