Identify and Annotate Differentially Expressed Genes and Pathways
The Identify and Annotate Differentially Expressed Genes and Pathways compares the gene expression in different groups of samples using an empirical analysis and performs a gene ontology (GO) enrichment analysis on the differentially expressed genes to identify affected pathways.
To run the ready-to-use workflow:
Toolbox | Ready-to-Use Workflows | Whole Transcriptome Sequencing (![]() ) | Identify and Annotate Differentially Expressed Genes and Pathways (
) | Identify and Annotate Differentially Expressed Genes and Pathways (![]() )
)
- Double-click on the Identify and Annotate Differentially Expressed Genes and Pathways ready-to-use workflow to start the analysis. If you are connected to a server, you will first be asked where you would like to run the analysis. Next, you will be asked to select the experiment to analyze (figure 16.34). To select an experiment (
 ), double-click on the experiment file name or click once on the file and then on the arrow pointing to the right side in the middle of the wizard. Click on the button labeled Next.
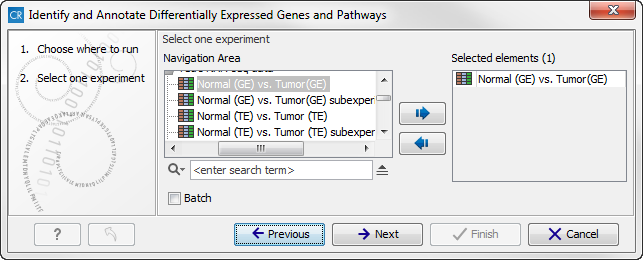
Figure 16.34: Select the experiment to analyze. - In the next wizard step you can specify the parameters to be used for extraction of differentially expressed genes.
Configurable Parameters
- Type of p-value This drop-down menu allows you to select between raw and corrected p-values. For a description of these, please see the Transcriptomics Chapter, section "Corrected p-values" in the CLC Genomics Workbench manual that can be found here: http://www.clcsupport.com/clcgenomicsworkbench/current/index.php?manual=Corrected_p_values.html. Only the types of p-values available for the given statistical analysis will be present in the drop-down menu.
- Maximum p-value In this input field, you can enter the maximum allowed p-value, as a number between 0 and 1. If you do not want any filtering based on p-value, enter 1.
- Minimum fold-change value You can also specify the minimum allowed fold-change value as a number greater than zero. If you do not want any filtering based on fold-change, enter 0.
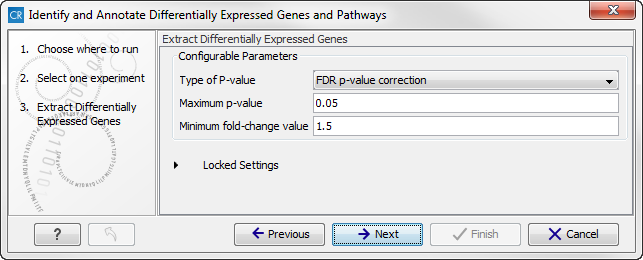
Figure 16.35: Select the parameters for extraction of differentially expressed genes. - Click on the button labeled Next to go to the next step where you can choose the gene ontology type you wish to use.
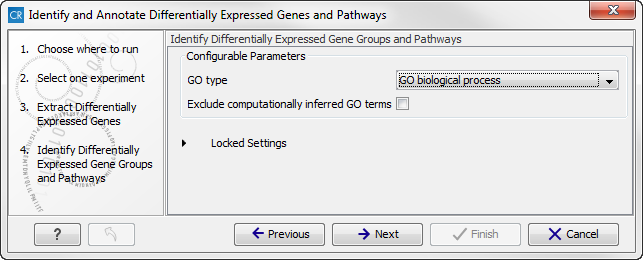
Figure 16.36: Select which gene ontology type to use. - In the next step you can choose to preview the settings and save the results (see figure 16.37).
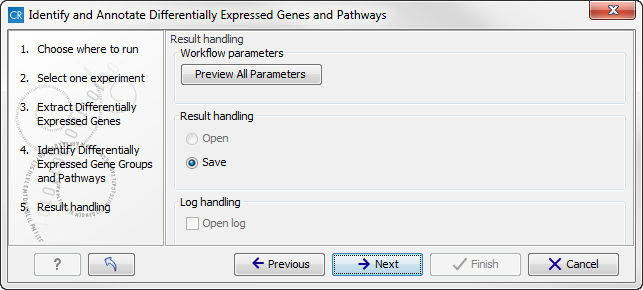
Figure 16.37: The results handling step. - Click on the button labeled "Preview All Parameters" if you would like to preview the settings. The parameters settings can be viewed but not edited in this view.
- Press OK, specify where to save the results, and then click on the button labeled Finish to run the analysis.
Three different types of output are generated:
- Annotated Differentially Expressed Genes (
 ) This is an annotation track that gives access to the expression values and other information. This information can be accessed in two different ways:
- Hold the mouse over or right-clicking on the track. A tooltip will appear with information about e.g. gene name, results of statistical tests, expression values, and GO information.
- Open the track in table format by clicking on the table icon in the lower left side of the View Area.
- Enriched Gene Groups and Pathways (
 ) A table showing the results of the GO enrichment analysis. The table includes GO terms, a description of the affected function/pathway, the number of genes in each function/pathway, the number of affected genes within the function/pathway, and p-values.
- Genome Browser View Differentially Expressed Genes and Pathways (
 ) A collection of tracks presented together. Shows the human reference sequence, annotation tracks for genes, coding regions, transcripts, and expression comparison with GO information, and a conservation score track (see figure 16.38).
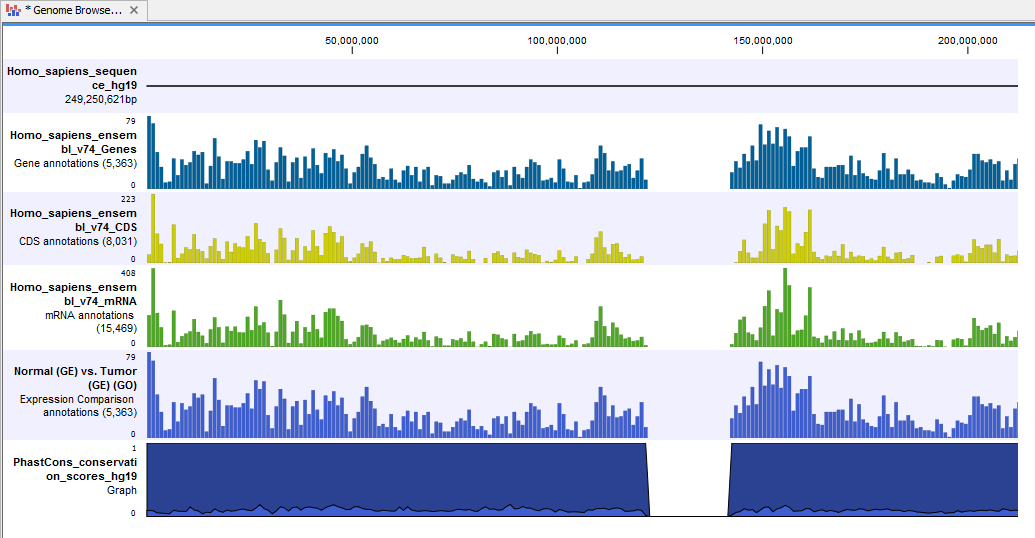
Figure 16.38: The genome browser view allows comparison of the expression comparison tracks with the reference sequence and different annotation tracks.