Coverage summary report
An example of a coverage report is shown in figure 19.3).
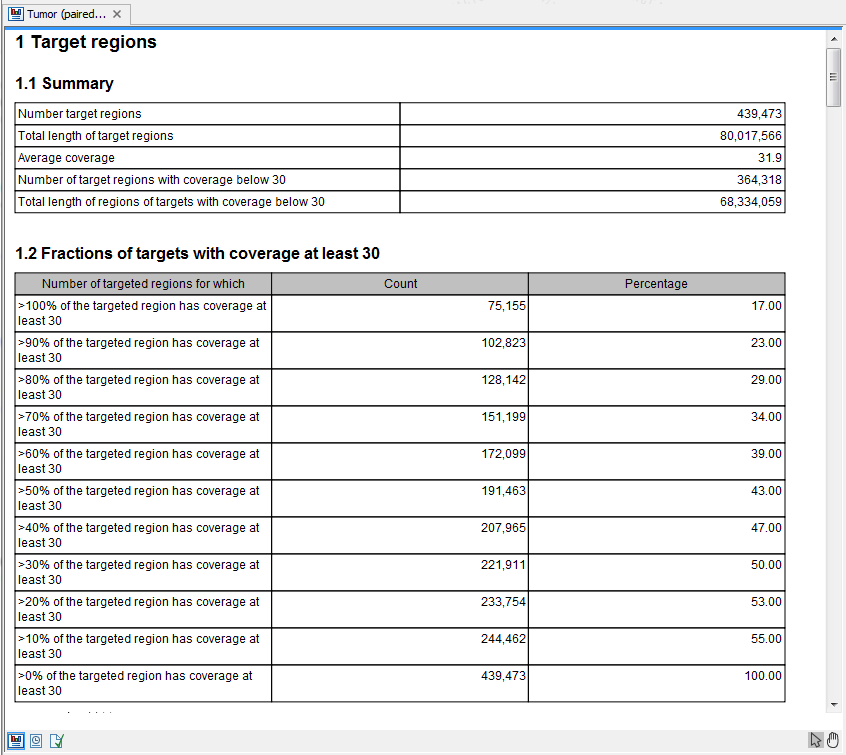
Figure 19.3: The report with overviews of mapped reads.
This figure shows only the top of the report. The full content is explained below:
- Coverage summary
- This table shows overall coverage information.
- Number target regions
- The number of targeted regions.
- Total length of target regions
- The sum of the size of all the targeted regions (this means it is calculated from the annotations alone and is not influenced by the reads).
- Average coverage
- For each position in each target region the coverage is calculated, and stored (you can see the individual coverages in the Coverage table output, figure 19.8). The 'average coverage' is calculated by taking the mean of all the calculated coverages in all the positions in all target regions. Note that if the user has chosen Ignore non-specific matches or Ignore broken pairs these reads will not contribute to the coverage. Note also that bases in over-lapping paired reads will only be counted as 1.
- Number of target regions with low coverage
- The number of target regions which have positions with a coverage that is below the user-specified Minimum coverage threshold.
- Total length of target regions with low coverage
- The total length of these regions.
- Fractions of targets with coverage at least...
- This table shows how many target regions have a certain percentage of the region above the user-specified Minimum coverage threshold.
- Fractions of targets with coverage at least...
- A histogram presentation of the table above in Fractions of targets with coverage at least....
- Coverage of target regions positions
- This plot shows the coverage level on the x axis, and the number of positions in the target regions with that coverage level.
- Coverage of target regions positions
- A version of the histogram above zoomed in to the values that lie +- 3SDs from the median.
- Minimum coverage of target regions
- This shows the percentage of the targeted regions that are covered by this many bases. The intervals can be specified in the dialog when running the analysis. Default is 1, 5, 10, 20, 40, 80, 100 times. In figure 19.4 this means that 26.58 % of the positions on the target are covered by at least 40 bases.
- Targeted regions overview
- This section contains two tables: one that summarizes, for each reference sequence, information relating to the reads mapped, and one that summarizes, for each reference, information relating to the bases mapped (figures 19.4 and 19.5). Note that, for the table that is concerned with reads, reads in over-lapping pairs are counted individually. Also note that, for the table that is concerned with bases, bases in overlapping paired reads are counted only as one (Examples are given in figures 19.6 and figure 19.7).
- Reference
- The name of the reference sequence.
- Total mapped reads
- The total number of mapped reads on the reference, including reads mapped outside the target regions.
- Mapped reads in targeted region
- Total number of reads in the targeted regions. Note that if there are overlapping regions, reads covered by two regions will be counted twice. If a read is only partially inside a targeted region, it will still count as a full read.
- Specificity
- The percentage of the total mapped reads that are in the targeted regions.
- Total mapped reads excl ingored
- The total number of mapped reads on the reference, including reads mapped outside the target regions, excluding the non-specific matches or broken pairs, if the user has switched on the option to ignore those.
- Mapped reads in targeted region excl ingored
- Total number of reads in the targeted regions, excluding the non-specific matches or broken pairs, if the user has switched on the option to ignore those.
- Specificity excl ingored
- The percentage of the total mapped reads that are in the targeted regions.
- Reference
- The name of the reference sequence.
- Total mapped bases
- The total number of mapped bases on the reference, including bases mapped outside the target regions.
- Mapped bases in targeted region
- Total number of bases mapped within in the targeted regions. Note that if there are overlapping regions, bases included in two regions will be counted twice.
- Specificity
- The percentage of the total mapped bases that are in the targeted regions.
- Total mapped bases excl ingored
- The total number of mapped bases on the reference, including bases mapped outside the target regions, excluding the bases in non-specific matches or broken pairs, if the user has switched on the option to ignore those.
- Mapped bases in targeted region excl ingored
- Total number of bases in the targeted regions, excluding the bases in non-specific matches or broken pairs, if the user has switched on the option to ignore those.
- Specificity excl ingored
- The percentage of the total mapped bases that are in the targeted regions.
- Distribution of target region length
- A plot of the length of the target regions, and a version of the plot where only the target region lengths that lie within +3SDs of the median target length are shown.
- Base coverage
- The percentage of base positions in the target regions that are covered by respectively 0.1, 0.2, 0.3, 0.4, 0.5 and 1.0 times the mean coverage, where the mean coverage is the average coverage given in table 1.1. Because this is based on mean coverage, the numbers can be used for cross-sample comparison of the quality of the experiment.
- Base coverage plot
- A plot showing the relationship between fold mean coverage and the number of positions. This is a graphical representation of the Base coverage table above.
- Mean coverage per target position
- Three plots listing the mean coverage for each position of the targeted regions. The first plot shows coverage across the whole target, using a percentage of the target length on the x axis (to make it possible to have targets with different lengths in the same plot). This is reported for reverse and forward reads as well. In addition, there are two plots showing the same but with base positions on the x axis counting from the start and end of the target regions, respectively. These plots can be used to evaluate whether there is a general tendency towards lower coverage at the end of the targeted region, and whether there is a bias in terms of forward and reverse reads coverage.
- Read count per %GC
- The plot shows the GC content of the reference sequence on the X-axis and the number of mapped reads on the Y-axis. This plot will show if there is a basis caused by higher GC-content in the sequence.
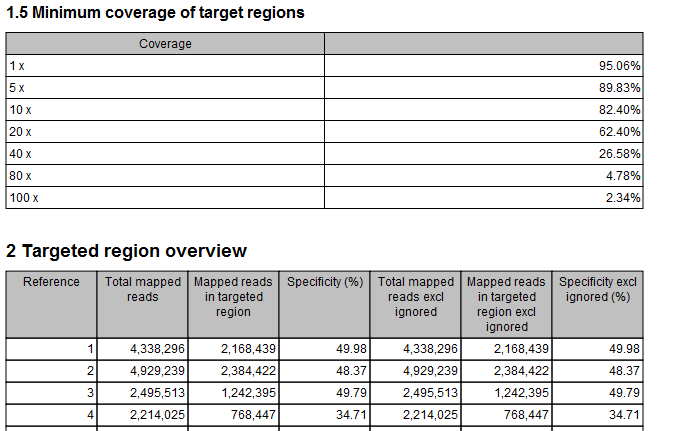
Figure 19.4: The report: mapped reads.
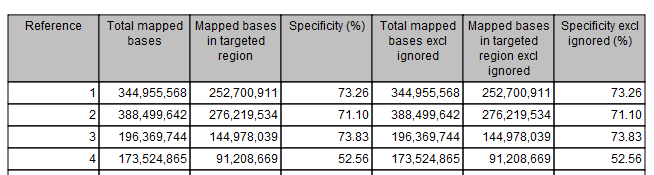
Figure 19.5: The report: mapped bases.