Identify Somatic Variants from Tumor Normal Pair (WGS)
The "Identify Somatic Variants from Tumor Normal Pair (WGS)" ready-to-use workflow can be used to identify potential somatic variants in a tumor sample when you also have a normal/control sample from the same patient.
When running the "Identify Somatic Variants from Tumor Normal Pair (WGS)" the reads are mapped and the variants identified. An internal workflow removes germline variants that are found in the mapped reads of the normal/control sample and variants outside the target region are removed as they are likely to be false positives due to non-specific mapping of sequencing reads. Next, remaining variants are annotated with gene names, amino acid changes, conservation scores and information from clinically relevant databases like COSMIC (known cancer associated variants) and ClinVar (variants with clinically relevant association). Finally, information from dbSNP is added to see which of the detected variants have been observed before and which are completely new.
-dup1How to run the "Identify Somatic Variants from Tumor Normal Pair" ready-to-use workflow
- Go to the toolbox and double-click on the "Identify Somatic Variants from Tumor Normal Pair" ready-to-use workflow
(figure 13.21).
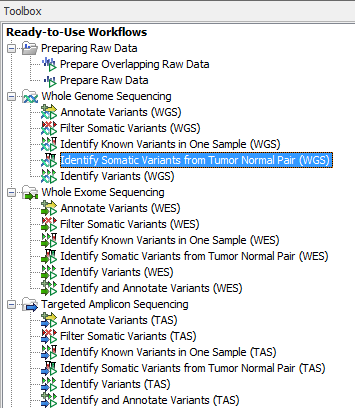
Figure 13.21: The ready-to-use workflows are found in the toolbox.This will open the wizard shown in figure 13.22 where you can select the tumor sample reads.
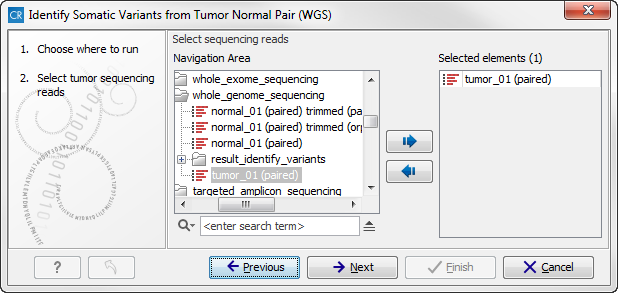
Figure 13.22: Select the tumor sample reads.When you have selected the tumor sample reads click on the button labeled Next.
- In the next wizard step (figure 13.23),
please specify the normal sample reads.
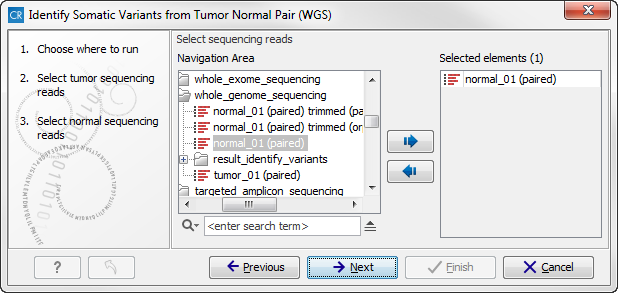
Figure 13.23: Select the normal sample reads. - When you have selected the sample(s) you wish to analyze, click on the button labeled Next. This and the following step allow you to restrict the calling of InDels and structural variants to targeted regions in case you would like to focus on only a parts of your whole genome sequencing data. If you would like to use the full data set, you can click on the button labeled Next to go to the next wizard step (figure 13.24).
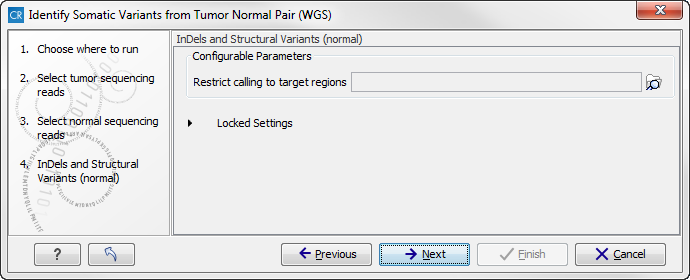
Figure 13.24: Specify a target regions track if you would like to restrict the analysis to only parts of the whole genome sequencing data set, otherwise click on the button labeled "Next". - This step allows to specify a target regions track for the tumor sample in case you would like to restrict the analysis to only parts of the whole genome sequencing data set (figure 13.25).
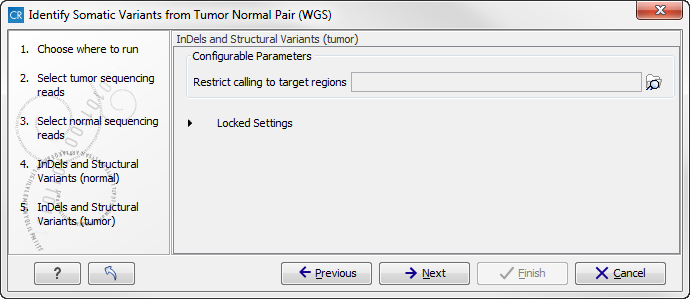
Figure 13.25: Specify a target regions track if you would like to restrict the analysis to only parts of the whole genome sequencing data set, otherwise click on the button labeled "Next". - Click on the button labeled Next to go to the next wizard step (figure 13.26).
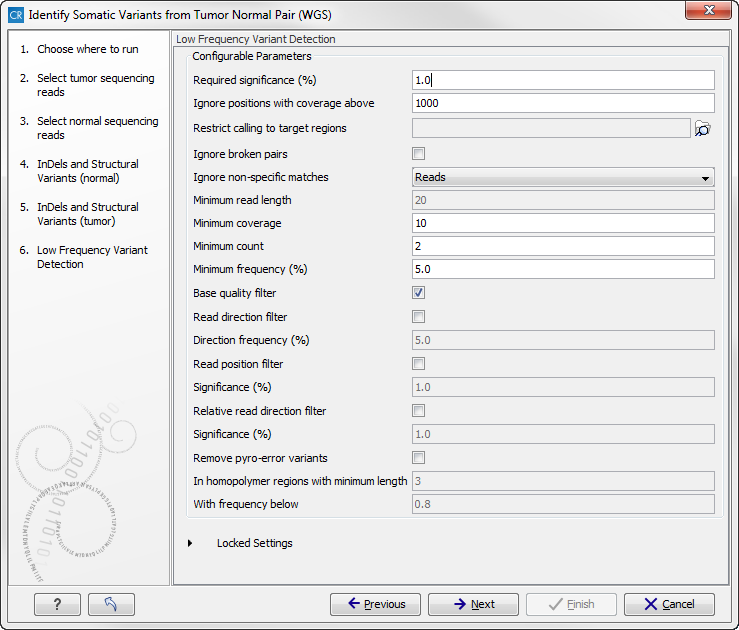
Figure 13.26: Specify the settings for the variant detection.In this wizard step you can adjust the settings used for variant detection. For a description of the different parameters that can be adjusted in the variant detection step, we refer to the description of the "Low Frequency Variant Detection" tool in the CLC Cancer Research Workbench user manual (http://www.clcsupport.com/clccancerresearchworkbench/current/index.php?manual=Low_Frequency_Variant_Detection.html). As general filters are applied to the different variant detectors that are available in CLC Cancer Research Workbench, the description of the filters are found in a separate section called "Filters" (see http://www.clcsupport.com/clccancerresearchworkbench/current/index.php?manual=Variant_Detectors_filters.html). If you click on "Locked Settings", you will be able to see all parameters used for variant detection in the ready-to-use workflow.
- Click on the button labeled Next to go to the step where you can adjust the settings for removal of germline variants (figure 13.27)..
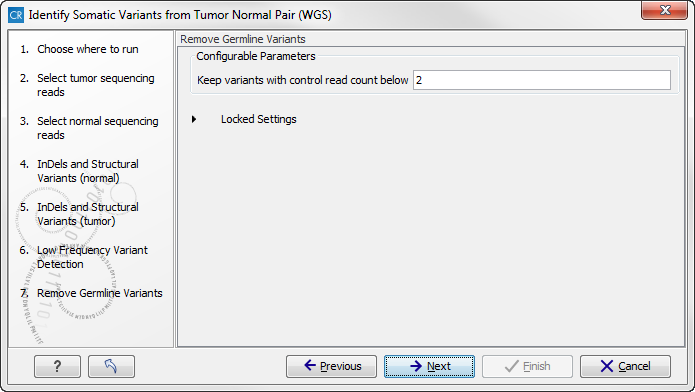
Figure 13.27: Specify setting for removal of germline variants. - Click on the button labeled Next.
In the next wizard step you can check the selected settings by clicking on the button labeled Preview All Parameters (figure 13.28).
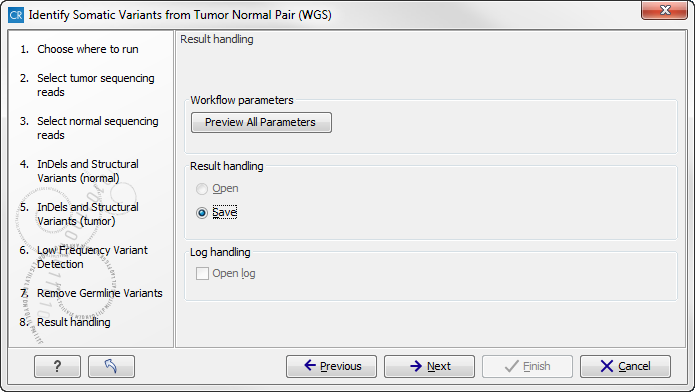
Figure 13.28: Check the parameters and save the results.In the Preview All Parameters wizard you can only check the settings, it is not possible to make any changes at this point. At the bottom of this wizard there are two buttons regarding export functions; one button allows specification of the export format, and the other button (the one labeled "Export Parameters") allows specification of the export destination. When selecting an export location, you will export the analysis parameter settings that were specified for this specific experiment.
- Click on the button labeled OK to go back to the previous wizard step and choose Save.
Note! If you choose to open the results, the results will not be saved automatically. You can always save the results at a later point.
Six different outputs are generated:
- Read Mapping Tumor (
 ) The mapped sequencing reads for the tumor sample. The reads are shown in different colors depending on their orientation, whether they are single reads or paired reads, and whether they map unambiguously. For the color codes please see the description of sequence colors in the CLC Genomics Workbench manual that can be found here: http://www.clcsupport.com/clcgenomicsworkbench/current/index.php?manual=View_settings_in_Side_Panel.html.
- Read Mapping Normal () The mapped sequencing reads for the normal sample. The reads are shown in different colors depending on their orientation, whether they are single reads or paired reads, and whether they map unambiguously. For the color codes please see the description of sequence colors in the CLC Genomics Workbench manual that can be found here: http://www.clcsupport.com/clcgenomicsworkbench/current/index.php?manual=View_settings_in_Side_Panel.html.
- Mapping Report Tumor (
 ) The report consists of a number of tables and graphs that in different ways provide information about the mapped reads from the tumor sample.
- Mapping Report Normal () The report consists of a number of tables and graphs that in different ways provide information about the mapped reads from the normal sample.
- Annotated Somatic Variants (
 ) A variant track holding the identified and annotated somatic variants. The variants can be shown in track format or in table format. When holding the mouse over the detected variants in the Genome Browser view a tooltip appears with information about the individual variants. You will have to zoom in on the variants to be able to see the detailed tooltip.
- Genome Browser View Tumor Normal Comparison (
 ) A collection of tracks presented together. Shows the annotated variants track together with the human reference sequence, genes, transcripts, coding regions, the mapped reads for both normal and tumor, the annotated somatic variants, information from the ClinVar and COSMIC databases, and finally a track showing the conservation score (see figure 13.29).
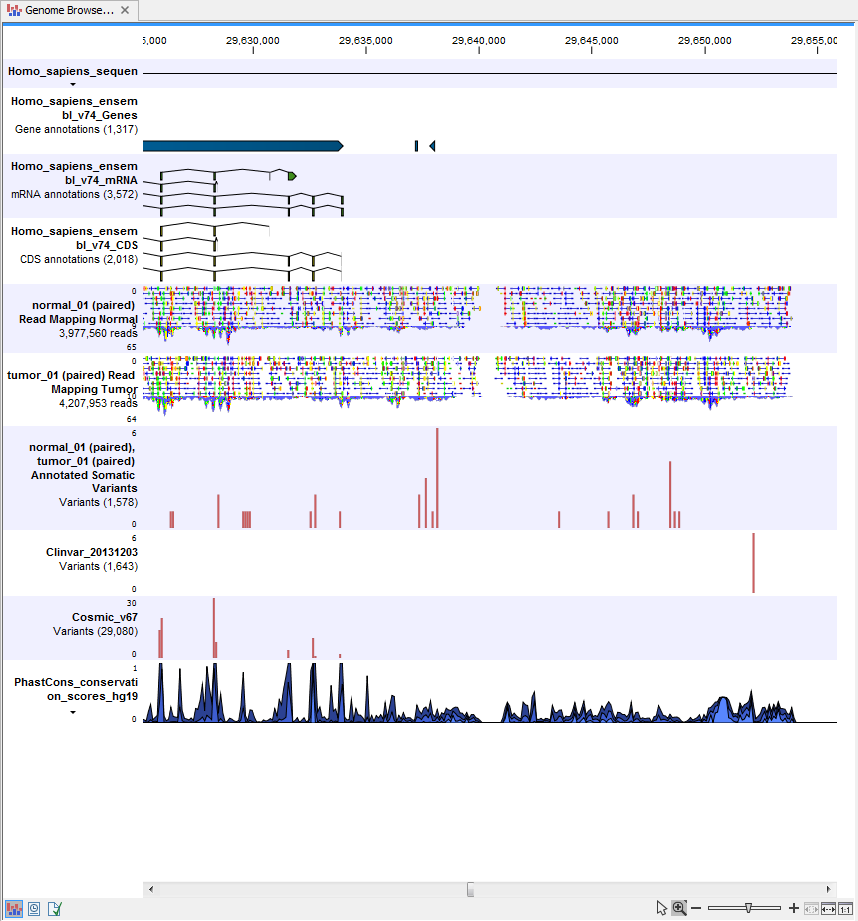
Figure 13.29: The Genome Browser View presents all the different data tracks together and makes it easy to compare different tracks.