Adding ideogram to Genome Browser View
An ideogram, also called a cytogenetic ideogram, is a chromosome map with numbered banding patterns that shows the relationship between the two chromosome arms and the centromere. Users of the UCSC Genome Browser (http://genome.ucsc.edu/) are most likely familiar with the use of cytogenetic ideogram in the UCSC Genome Browser. Ideograms can be imported into the Workbench (from UCSC) and be used in track lists to provide an overview of the analyzed data in context of the individual chromosomes. An example is shown in figure 18.5.
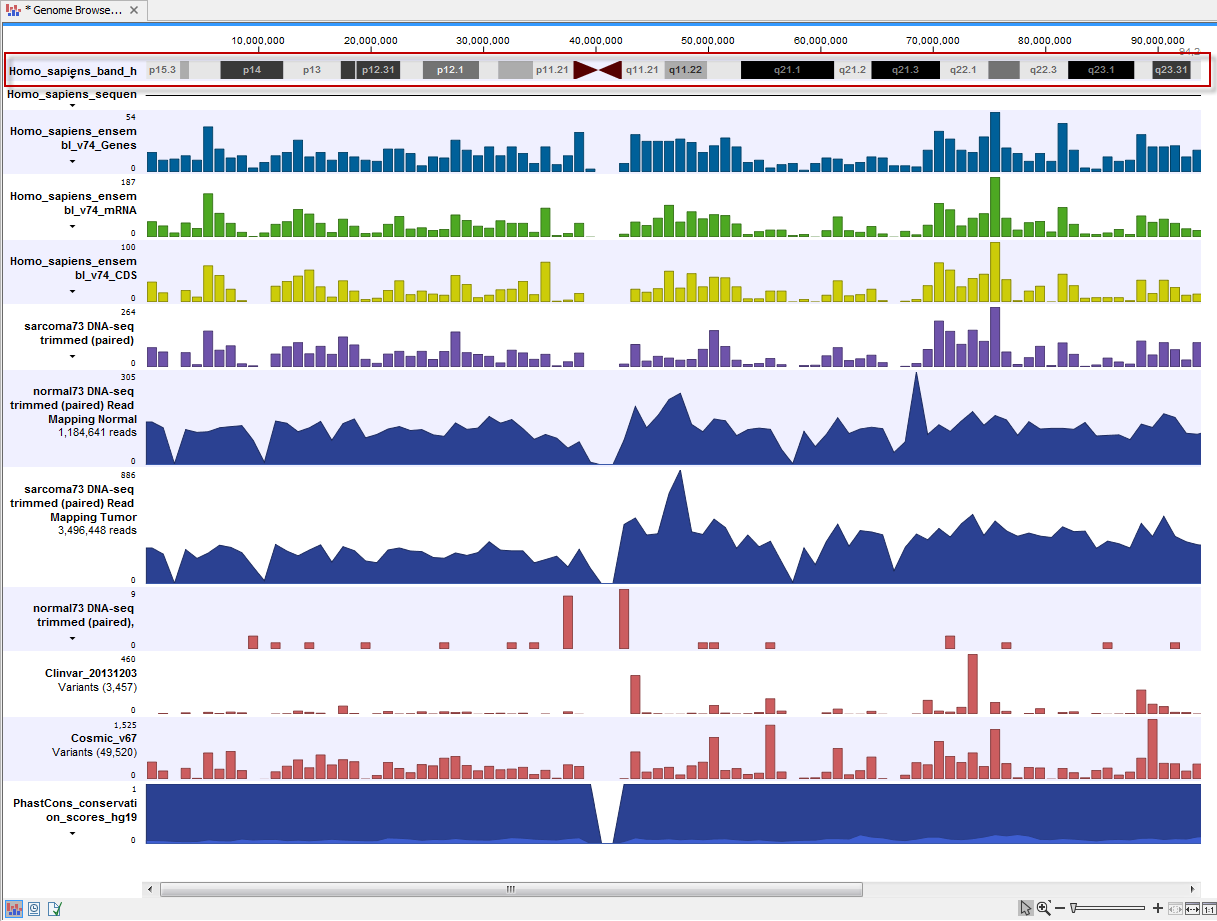
Figure 18.5: The ideogram is particularly useful when used in combination with other tracks in a track list. In this figure the ideogram is highlighted with a red box.
The ideogram is automatically imported into CLC Cancer Research Workbench along with the reference data the first time the reference data is imported into the CLC Cancer Research Workbench. This is done with the Data Management function found in the upper right corner of the Workbench.
Data Management (![]() )
)
For a description of how to import reference data into CLC Cancer Research Workbench we refer to Download and configure reference data.
The ideogram can be found in the Navigation Area in the CLC_References folder as shown in figure 18.6. To include an ideogram in a Genome Browser View, you can click once on the ideogram in the Navigation Area and while holding down the mouse key, you can drag the ideogram into an Genome Browser View that is open in the View Area.
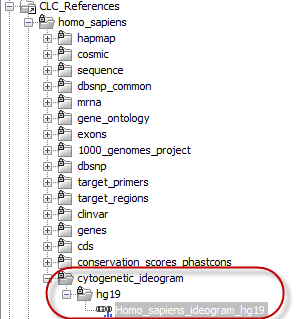
Figure 18.6: The ideogram is part of the reference data and is particularly useful when used in combination with other tracks in a Genome Browser View.