Running the Coverage analysis tool
To run the Coverage analysis tool:
Toolbox | Resequencing Analysis (![]() ) |
Coverage Analysis (
) |
Coverage Analysis (![]() )
)
This opens the dialog shown in figure 21.39.
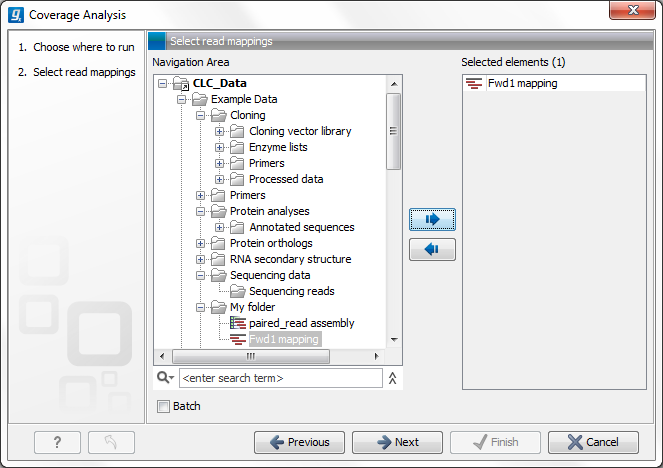
Figure 21.39: Select read mapping results.
Select a reads track or read mapping and click Next. This opens the dialog shown in figure 21.40.
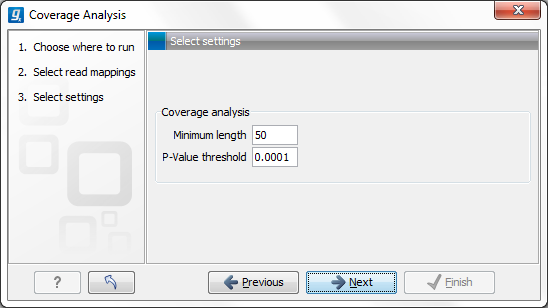
Figure 21.40: Specify the p-value cutoff.
Set the p-value and minimum length cutoff.
Click Next and specify the result handling (figure 21.41).
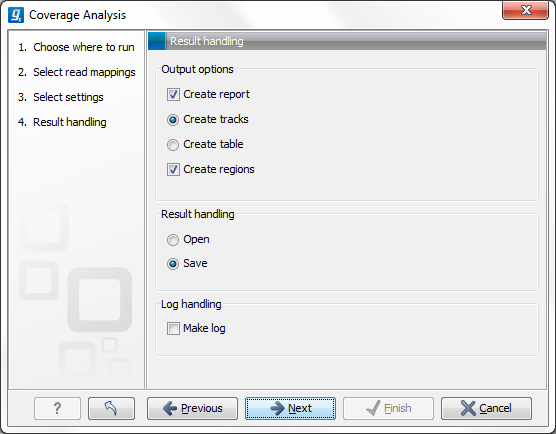
Figure 21.41: Specify the output.
Open or save and click Finish.
An example of a track output of the Coverage analysis tool is shown in figure 21.42.
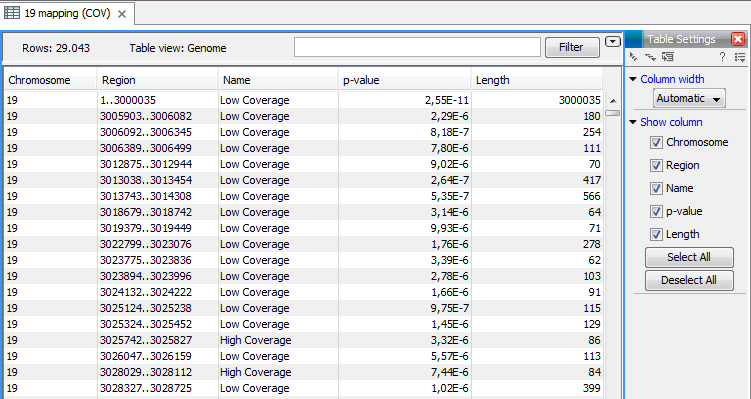
Figure 21.42: An example of a track output of the Coverage analysis tool.
In the CLC Cancer Research Workbench resequencing is the overall category for applications comparing genetic variation of a sample to a reference sequence. This can be targeted resequencing of a single locus or whole genome sequencing. The overall workflow will typically involve read mapping, some sort of variant detection and interpretation of the variants.
This chapter describes the tools relevant for the resequencing workflows downstream from the actual read mapping.
First comes a description of a tool to perform quality check of targeted resequencing approaches, next we describe the three variant callers that come with the CLC Cancer Research Workbench for finding variants, followed by a section describing a coverage analysis tool used to identify fluctuations in coverage. Next, the format of the variants are described, and finally we go through the various tools for filtering, comparing and annotating variants.