How to run the "Identify Somatic Variants from Tumor Normal Pair" ready-to-use workflow
- Go to the toolbox and double-click on the "Identify Somatic Variants from Tumor Normal Pair" ready-to-use workflow
(figure 14.24).
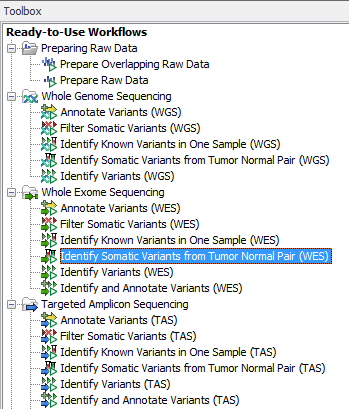
Figure 14.24: The ready-to-use workflows are found in the toolbox.This will open the wizard shown in figure 14.25 where you can select the tumor sample reads.
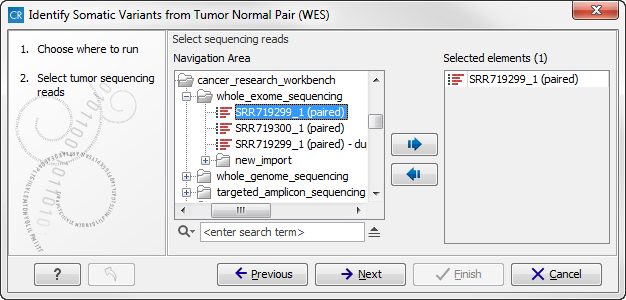
Figure 14.25: Select the tumor sample reads.When you have selected the tumor sample reads click on the button labeled Next.
- In the next wizard step (figure 14.26),
please specify the normal sample reads.
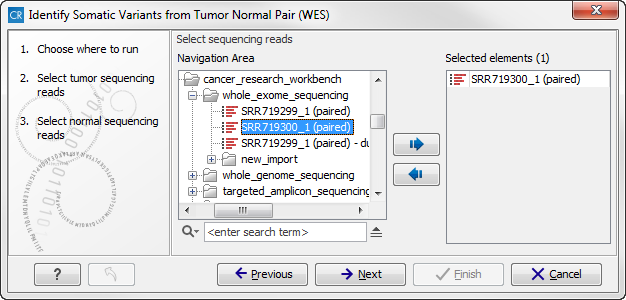
Figure 14.26: Select the normal sample reads. - When you have selected the sample(s) you wish to analyze, click on the button labeled Next. This step allow you to restrict the calling of InDels and structural variants to the targeted regions (figure 14.27).
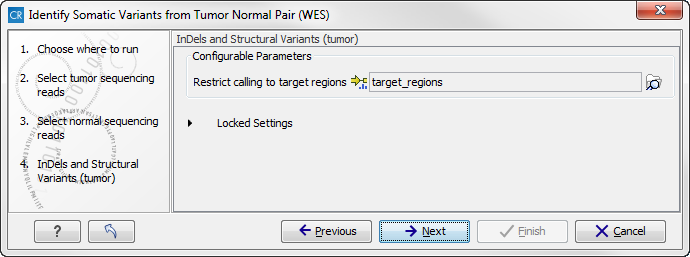
Figure 14.27: Specify the target regions track. - Click on the button labeled Next to go to the next wizard step (figure 14.28).
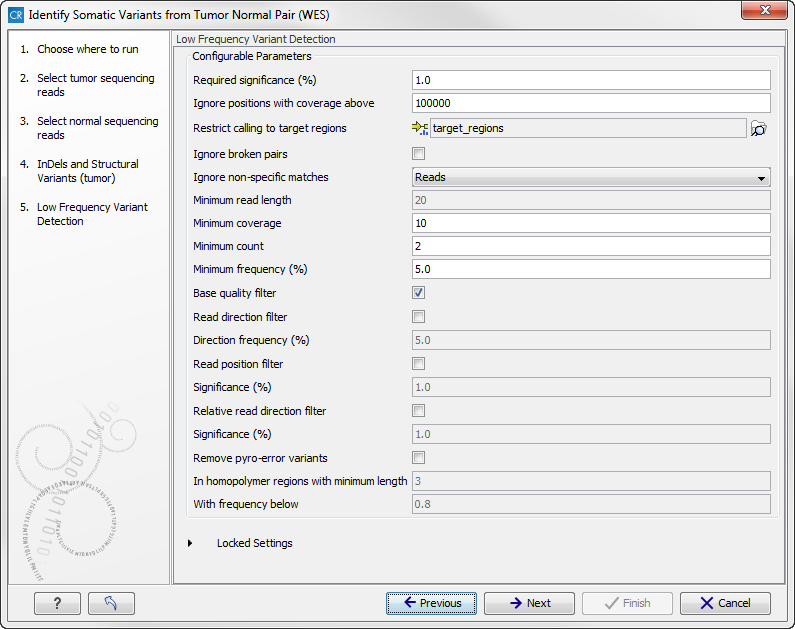
Figure 14.28: Specify the settings for the variant detection. - Click on the button labeled Next, which will take you to the next wizard step (figure 14.29). In this wizard step you can select your target regions track to be used for reporting the performance of the targeted re-sequencing experiment for the tumor sample.
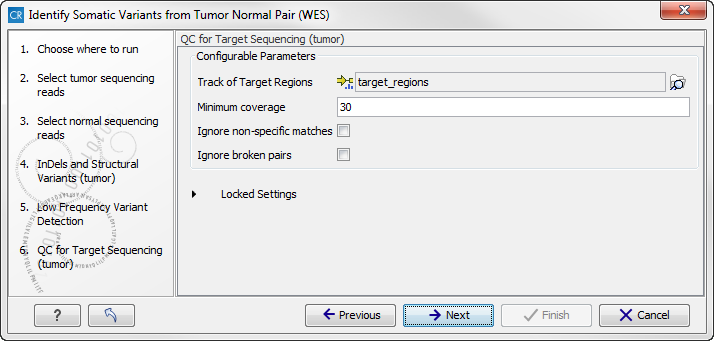
Figure 14.29: Select your target region track. - Click on the button labeled Next to specify the target regions track to be used in the "Remove Variants Outside Targeted Regions" step (figure 14.30). The targeted region track should be the same as the track you selected in the previous wizard step. Variants found outside the targeted regions will not be included in the output that is generated with the ready-to-use workflow.
Click on the button labeled Next.
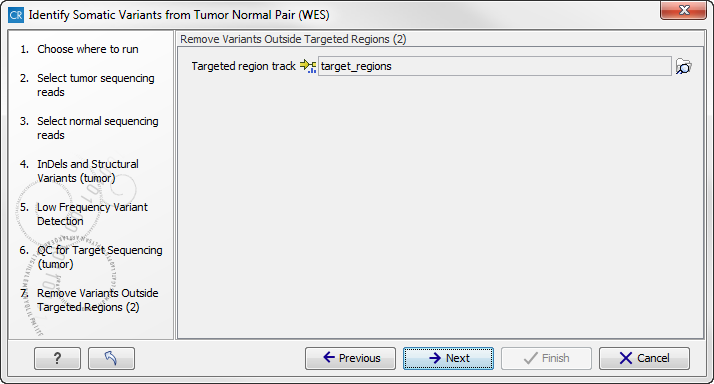
Figure 14.30: Select your target region track. - Click on the button labeled Next to go to the step where you can adjust the settings for removal of germline variants (figure 14.31)..
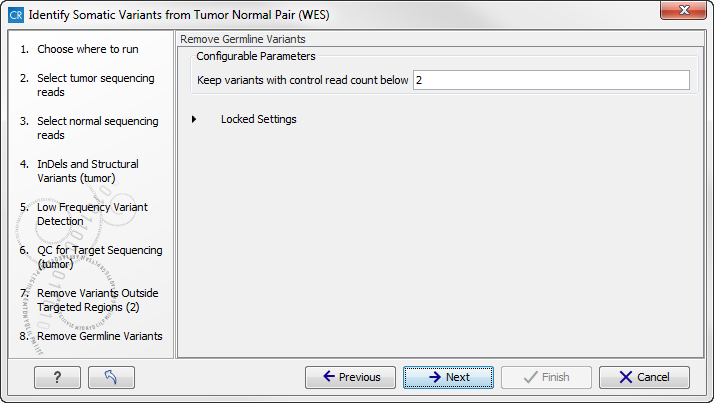
Figure 14.31: Specify setting for removal of germline variants. - Click on the button labeled Next and once again select the target region track (the same track as you have already selected in previous wizard steps). (figure 14.32).
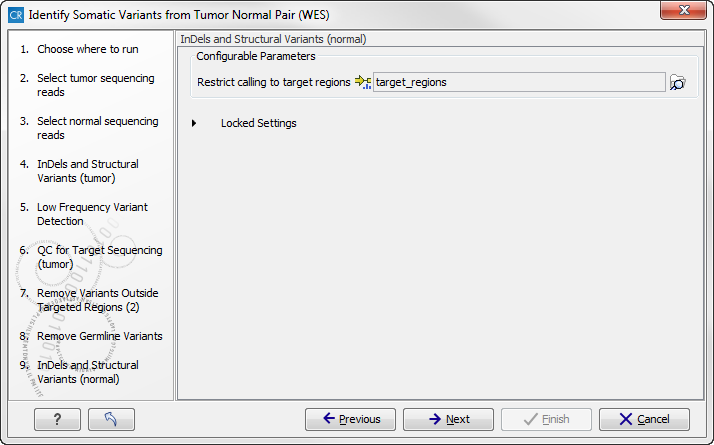
Figure 14.32: Select target region track.In the next wizard step you must once again select your target regions track. This time you specify the track to be used for quality control of the targeted sequencing as this tool reports the performance (enrichment and specificity) of a targeted re-sequencing experiment (figure 14.33).
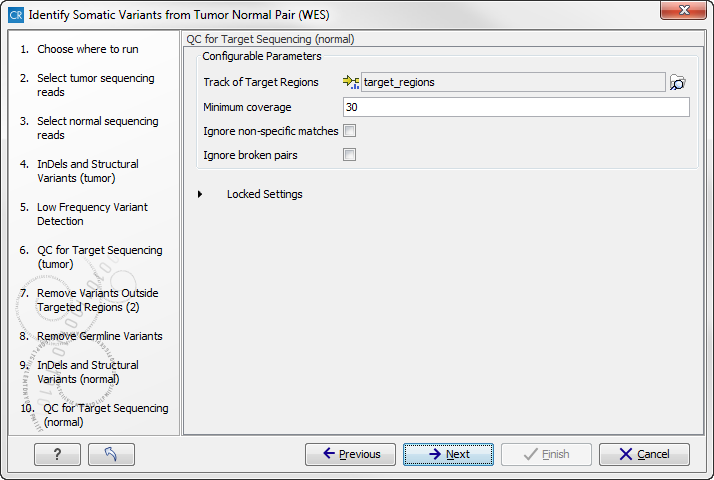
Figure 14.33: Select the target regions track.In the next wizard step you can check the selected settings by clicking on the button labeled Preview All Parameters (figure 14.34).
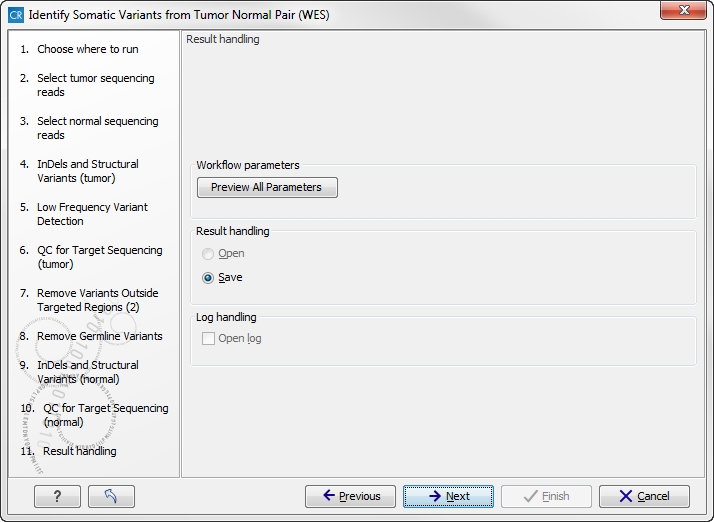
Figure 14.34: Check the parameters and save the results.In the Preview All Parameters wizard you can only check the settings, it is not possible to make any changes at this point. At the bottom of this wizard there are two buttons regarding export functions; one button allows specification of the export format, and the other button (the one labeled "Export Parameters") allows specification of the export destination. When selecting an export location, you will export the analysis parameter settings that were specified for this specific experiment.
- Click on the button labeled OK to go back to the previous wizard step and choose Save.
Note! If you choose to open the results, the results will not be saved automatically. You can always save the results at a later point.
Eight different outputs are generated:
- Read Mapping Normal (
 ) The mapped sequencing reads for the normal sample. The reads are shown in different colors depending on their orientation, whether they are single reads or paired reads, and whether they map unambiguously. For the color codes please see the description of sequence colors in the CLC Genomics Workbench manual that can be found here: http://www.clcsupport.com/clcgenomicsworkbench/current/index.php?manual=View_settings_in_Side_Panel.html
- Read Mapping Tumor () The mapped sequencing reads for the tumor sample. The reads are shown in different colors depending on their orientation, whether they are single reads or paired reads, and whether they map unambiguously. For the color codes please see the description of sequence colors in the CLC Genomics Workbench manual that can be found here: http://www.clcsupport.com/clcgenomicsworkbench/current/index.php?manual=View_settings_in_Side_Panel.html.
- Target Region Coverage Report Normal (
 ) The report consists of a number of tables and graphs that in different ways provide information about the mapped reads from the normal sample.
- Target Region Coverage Tumor (
 ) A track showing the targeted regions. The table view provides information about the targeted regions such as target region length, coverage, regions without coverage, and GC content.
- Target Region Coverage Report Tumor () The report consists of a number of tables and graphs that in different ways provide information about the mapped reads from the tumor sample.
- Variants (
 ) A variant track holding the identified variants that are found in the targeted resions. The variants can be shown in track format or in table format. When holding the mouse over the detected variants in the Genome Browser view a tooltip appears with information about the individual variants. You will have to zoom in on the variants to be able to see the detailed tooltip.
- Annotated Somatic Variants () A variant track holding the identified and annotated somatic variants. The variants can be shown in track format or in table format. When holding the mouse over the detected variants in the Genome Browser view a tooltip appears with information about the individual variants. You will have to zoom in on the variants to be able to see the detailed tooltip.
- Genome Browser View Tumor Normal Comparison (
 ) A collection of tracks presented together. Shows the annotated variants track together with the human reference sequence, genes, transcripts, coding regions, the mapped reads for both normal and tumor, the annotated somatic variants, information from the ClinVar and COSMIC databases, and finally a track showing the conservation score (see figure 14.35).
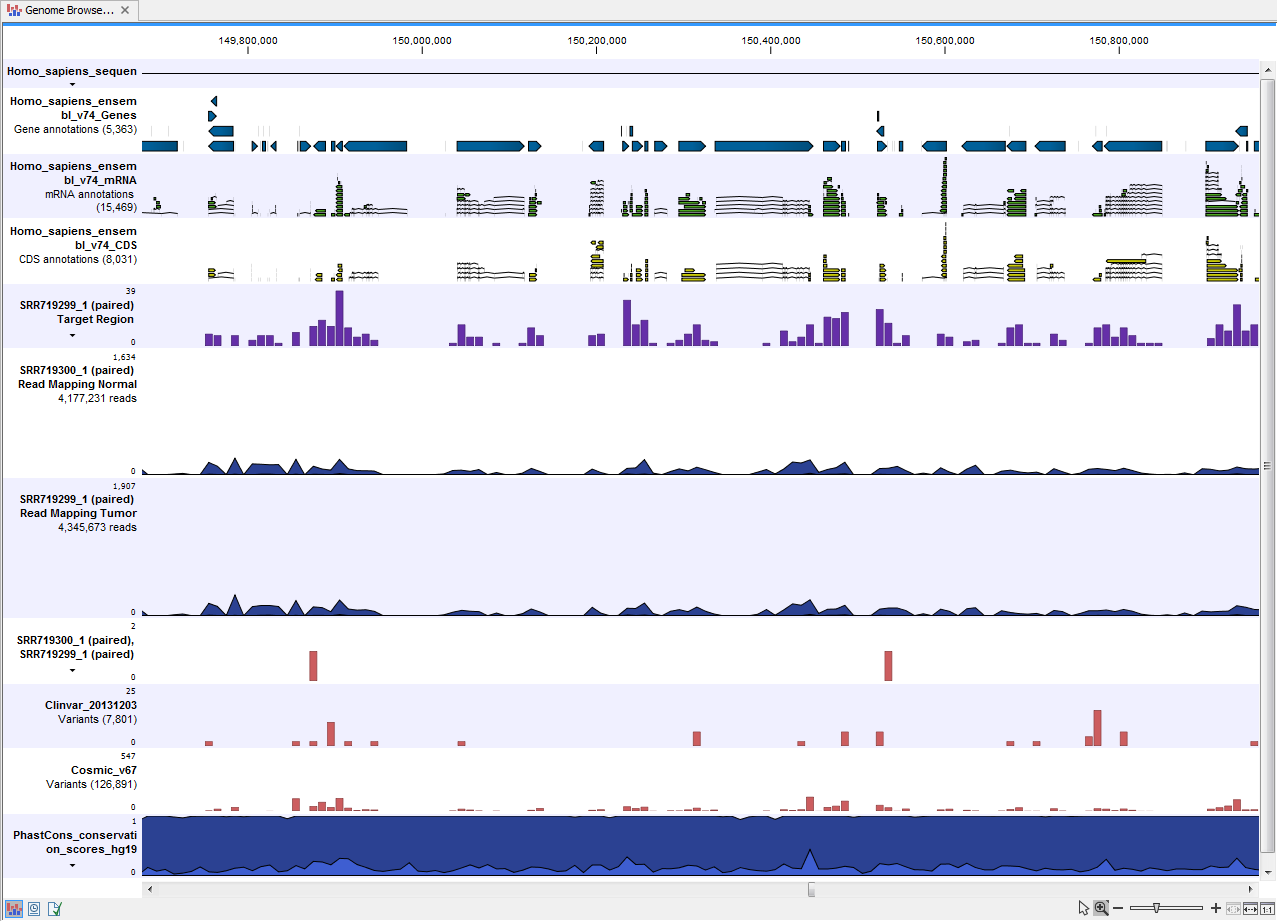
Figure 14.35: The Genome Browser View presents all the different data tracks together and makes it easy to compare different tracks.