Table outputs
Some analyses also generate a table with results, and for these analyses the last step looks like figure 8.6.
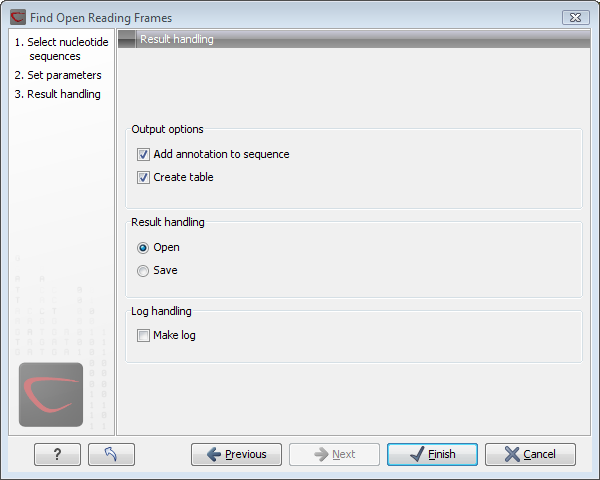
Figure 8.6: Analyses which also generate tables.
In addition to the Open and Save options you can also choose whether the result of the analysis should be added as annotations on the sequence or shown on a table. If both options are selected, you will be able to click the results in the table and the corresponding region on the sequence will be selected.
If you choose to add annotations to the sequence, they can be
removed afterwards by clicking Undo (![]() ) in the
Toolbar.
) in the
Toolbar.