Report of merged pairs
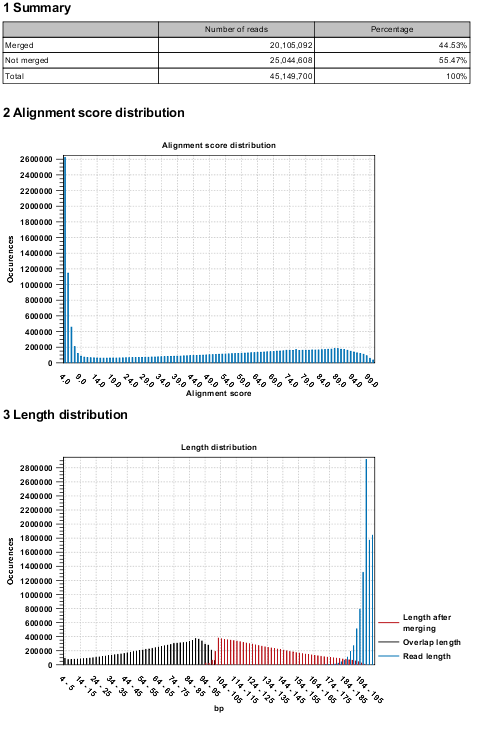
Figure 20.2 shows an example of the report generated when merging overlapping pairs.

Figure 20.12: Report of overlapping pairs.
It contains three sections:
- A summary showing the numbers and percentages of reads that have been merged.
- A plot of the alignment scores. This can be used to guide the choice of minimum alignment score as explained in Merge overlapping pairs.
- A plot of read lengths. This shows the distribution of read lengths for the pairs that have been merged:
- The length of the overlap.
- The length of the merged read.
- The combined length of the two reads in the pair before merging.
