Running the "QC for Read Mapping" tool
The tool is found in the Toolbox:
Toolbox | Quality Control (![]() ) | QC for Read Mapping (
) | QC for Read Mapping (![]() )
)
This opens a dialog where you can select mapping results (![]() )/ (
)/ (![]() )/ (
)/ (![]() ) or RNA-Seq analysis results (
) or RNA-Seq analysis results (![]() ).
).
Clicking Next will display the dialog shown in figure 19.12
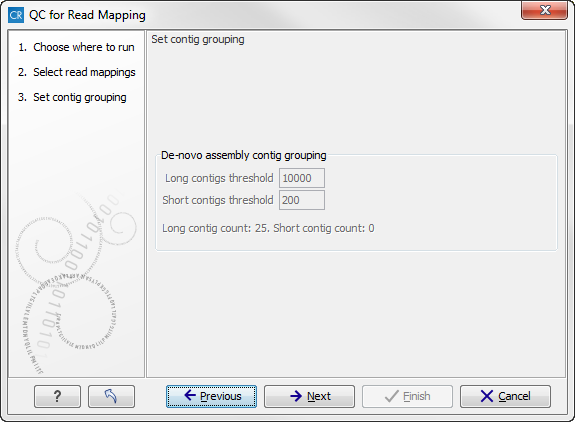
Figure 19.1: Parameters for mapping reports.
The next wizard step shows the used thresholds for the mapping report. These parameters cannot be modified by the user (as thresholds can only be specified for de novo assemblies that does not have a consensus sequence). Whenever a consensus sequence is present the "De novo assembly contig grouping" options are disabled.
Click Next to select output options as shown in figure 19.13
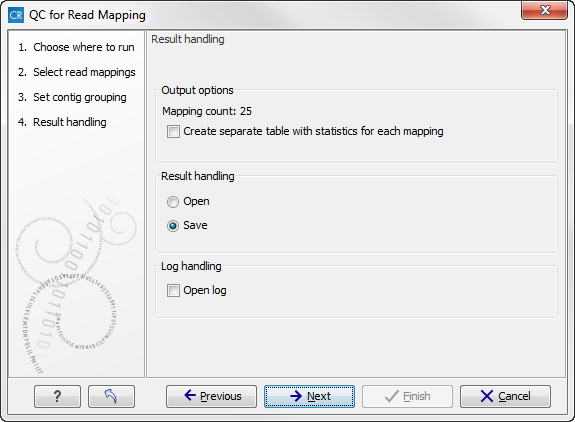
Figure 19.2: Optionally create a table with detailed statistics per reference.
Per default, an overall report will be created as described below. In addition, by checking Create table with statistics for each mapping, you can create a table showing detailed statistics for each reference sequence. The following sections describe the information produced.
Subsections