Running the ChIP-Seq Analysis tool
To run the ChIP-Seq Analysis tool:
Toolbox | Epigenomics Analysis (![]() ) | ChIP-Seq Analysis (
) | ChIP-Seq Analysis (![]() )
)
This will open up the wizard shown in figure 33.5 where you can select the input data (the mapped ChIP-seq reads). Multiple inputs (e.g. replicate experiments) are accepted, provided that they refer to the same genome. Track based read mappings (![]() ) and stand-alone read mappings (
) and stand-alone read mappings (![]() ) / (
) / (![]() ) are both accepted.
) are both accepted.
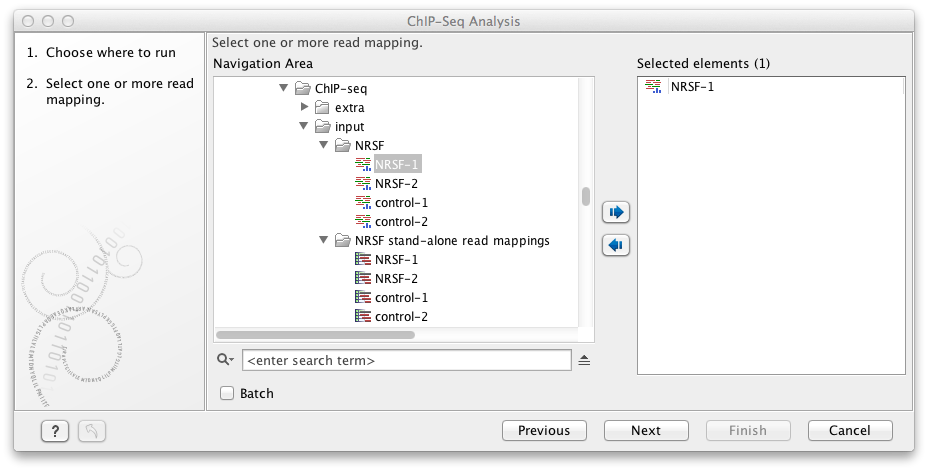
Figure 33.5: Select the input data for ChIP-Seq Analysis.
Click on the button labeled Next to go to the next wizard step (shown in figure 33.6).
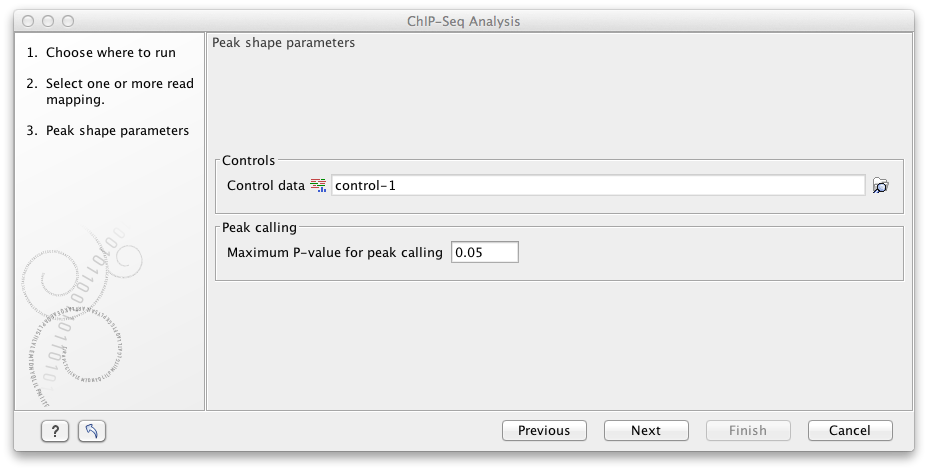
Figure 33.6: Options for ChIP-Seq Analysis.
In this wizard step you have the following options:
- Control data The control data, typically a ChIP-seq sample where the immunoprecipitation step is omitted, can be specified in this option.
- Maximum P-value for peak calling The threshold for reporting peaks can be specified by the option.
Click on the button labeled Next to go to the wizard step shown in figure 33.7.
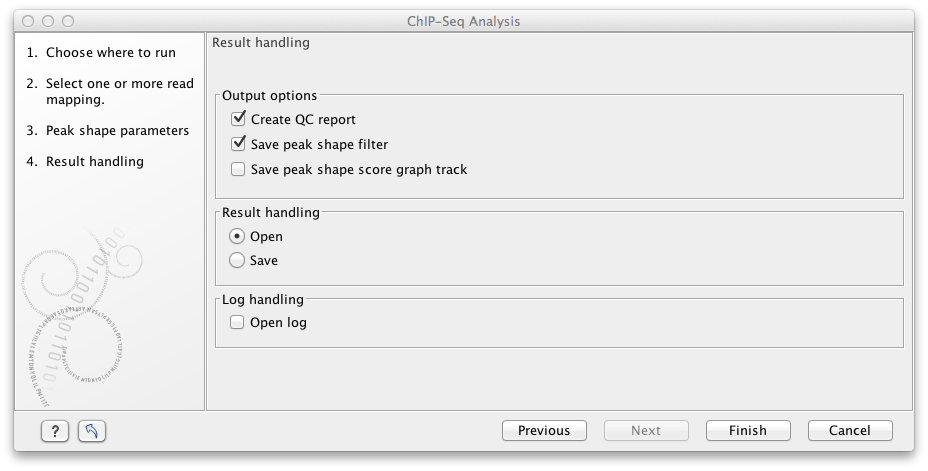
Figure 33.7: Output options for ChIP-Seq Analysis.
In addition to the annotation track with Peak
annotations (![]() ) that will always be generated by the
algorithm, you can choose to select additional output types.
) that will always be generated by the
algorithm, you can choose to select additional output types.
The options are:
- QC report (
 ) Generates a quality control
report that allows you to check the quality of the reads. The QC report contains
metrics about the quality of the ChIP-seq experiment. It lists the
number of mapped reads, the normalized strand coefficient, and the relative
strand correlation for each mapping. For each metric, the Status column will
be OK if the experiment has good quality or Low if the metric is not as high as expected.
Furthermore, the QC report will show the mean read length, the inferred fragment length, and the window size that the algorithm would need to be able to model the signal shape. In case the input contains paired-end reads, the report will also contain the empirical fragment length distribution.
The metrics and their definitions are described in more detail in
Quality Control of ChIP-seq data.
) Generates a quality control
report that allows you to check the quality of the reads. The QC report contains
metrics about the quality of the ChIP-seq experiment. It lists the
number of mapped reads, the normalized strand coefficient, and the relative
strand correlation for each mapping. For each metric, the Status column will
be OK if the experiment has good quality or Low if the metric is not as high as expected.
Furthermore, the QC report will show the mean read length, the inferred fragment length, and the window size that the algorithm would need to be able to model the signal shape. In case the input contains paired-end reads, the report will also contain the empirical fragment length distribution.
The metrics and their definitions are described in more detail in
Quality Control of ChIP-seq data.
- Peak shape filter (
 ) The peak shape filter contains the Hotelling
Observer filter that was learned by ChIP-Seq Analysis.
For the definition of Peak shape, see Applying peak shape filters to call peaks.
) The peak shape filter contains the Hotelling
Observer filter that was learned by ChIP-Seq Analysis.
For the definition of Peak shape, see Applying peak shape filters to call peaks.
- Peak shape score (
 ) A graph track containing the peak shape score.
The track shows the peak shape score for each genomic position. To save disk space,
only peak shape scores greater than zero are reported. For the definition of peak shape score, see Applying peak shape filters to call peaks.
) A graph track containing the peak shape score.
The track shows the peak shape score for each genomic position. To save disk space,
only peak shape scores greater than zero are reported. For the definition of peak shape score, see Applying peak shape filters to call peaks.
Choose whether you want to open the results directly, or save the results in the Navigation Area. If you choose to save the results, you will be asked to specify where you would like to save them.
Subsections