Interpreting the results of the Extract Differentially Expressed Genes tool
The Extract Differentially Expressed Genes tool will produce a track or several tracks, if filtering based on analysis results was chosen. The track(s) will contain the following annotations:
- All experiment-specific columns from the experiment
- All user-defined annotations added to the experiment
- All analysis-specific columns from the experiment
- All group-specific columns from the experiment
- Those of the following sample-specific columns when present in the experiment (for each sample): Expression values, Total exon reads, and RPKM.
Two different view options exist: the Genome Browser View and the Table View. When opening the annotated output result, the default view is the Genome Browser View. It is possible to open both views in split view by holding down the Ctrl key while clicking on the table icon in the lower left corner of the View Area. The two different views are linked together. This means that when you click once on an entry in the table, the Genome Browser View will jump the the selected region. With the Zoom to Selection (![]() ) button it is possible to jump to and zoom in on the selected region (figure 28.59).
) button it is possible to jump to and zoom in on the selected region (figure 28.59).
The results of any statistical test executed on the experiment, including fold-changes and p-values, can be seen in the tooltip when hovering over each region in the annotation track shown in Genome Browser View (figure 28.60).
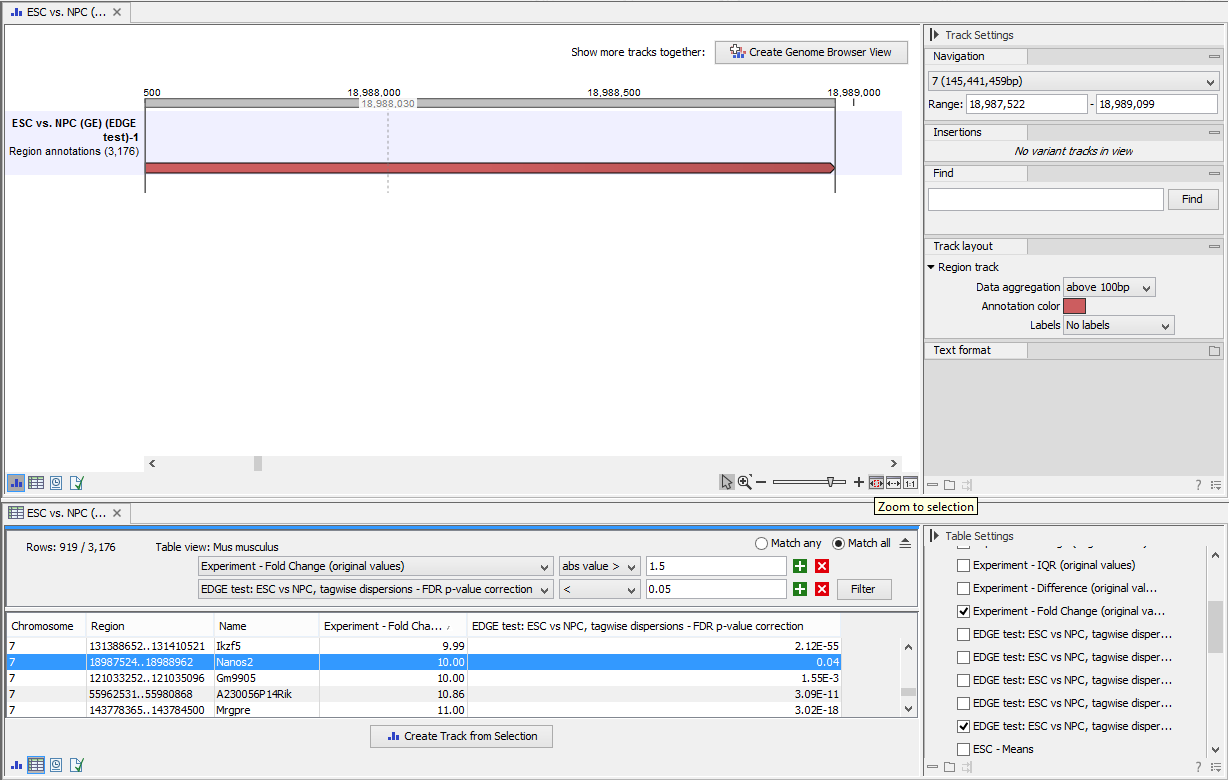
Figure 28.59: Viewing the track produced by the Extract Differentially Expressed Genes Tool
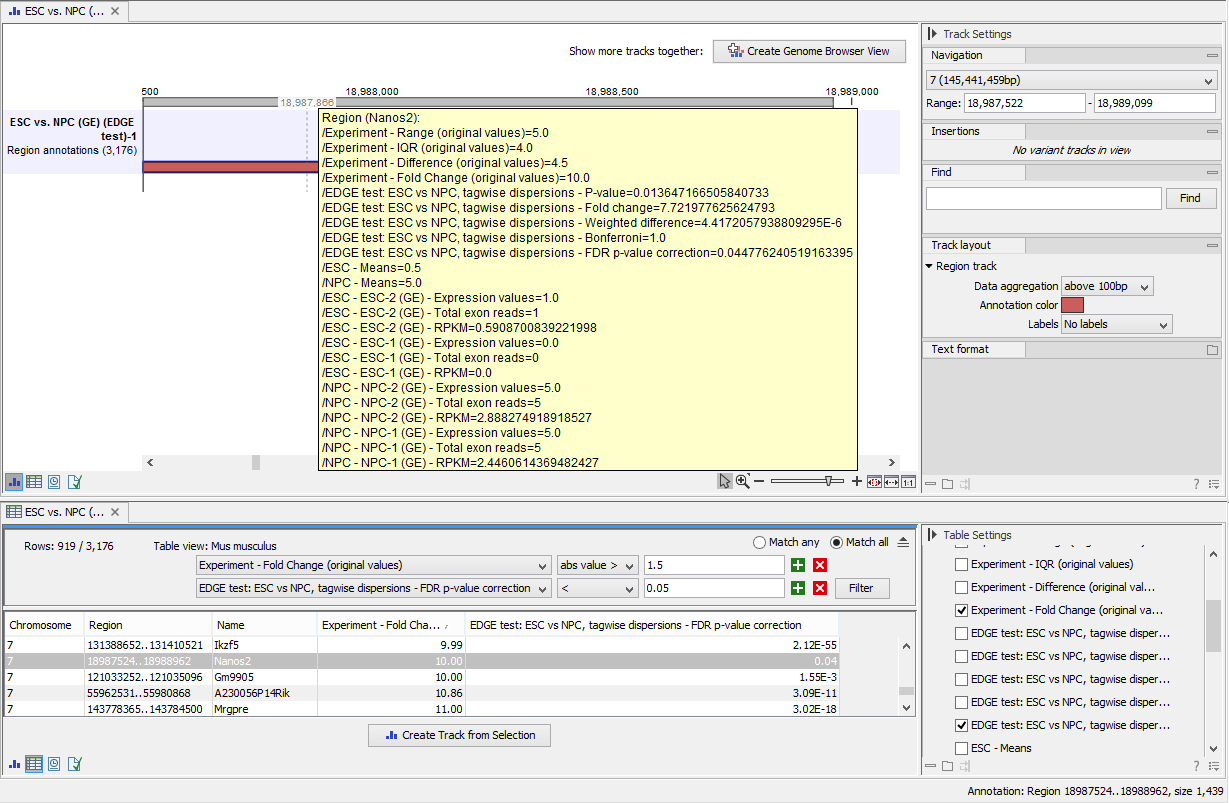
Figure 28.60: The annotations on the track produced by the Extract Differentially Expressed Genes Tool