Variant Detectors - error model estimation
The Fixed Ploidy and Low Frequency Variant Detection tools both rely on statistical models for the sequencing error rates. An error model is assumed and estimated for each quality score. Typically low quality read nucleotides will have a higher error rate than high quality nucleotides. In the error models, different types of errors have their own parameter, so if A's for example more often tend to result in erroneous G's than other nucleotides, that is also recognized by the error models. The parameters are all estimated from the data set being analyzed, so will adapt to the sequencing technology used and the characteristics of the particular sequencing runs. Information on the estimated error rates can be found in the Reports (see Variant Detectors - the outputs).
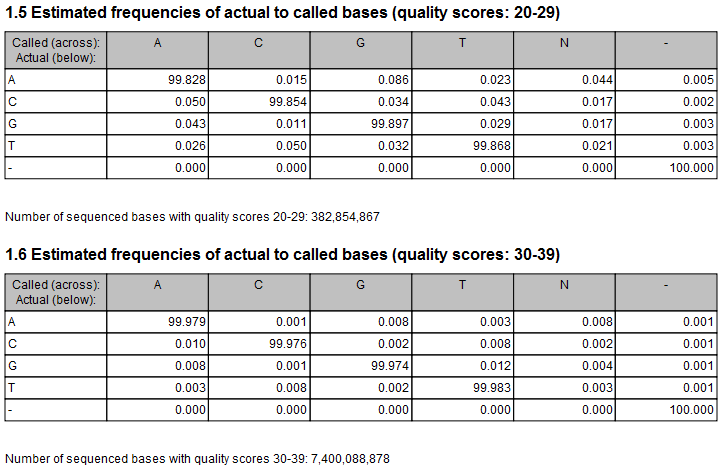
Figure 21.52: Example of estimated error rates. The figure shows average estimated error rates across bases in the given quality score intervals (20-29 and 30-39, respectively). Higher error rates are estimated for bases with lower quality scores.
An example of error rates estimated from a whole exome sequencing Illumina data set is shown in figure 21.52. As expected, the estimated error rates (that is, the off-diagonal elements in the matrices in the figure) are higher for the lower quality nucleotides than for higher. Note that, although the matrices in the figure show error rates of bases within ranges of quality scores, a separate matrix is estimated for each quality score in the error model estimation.