Mapping parameters
Clicking Next leads to the parameters for the read mapping (see figure 21.12).
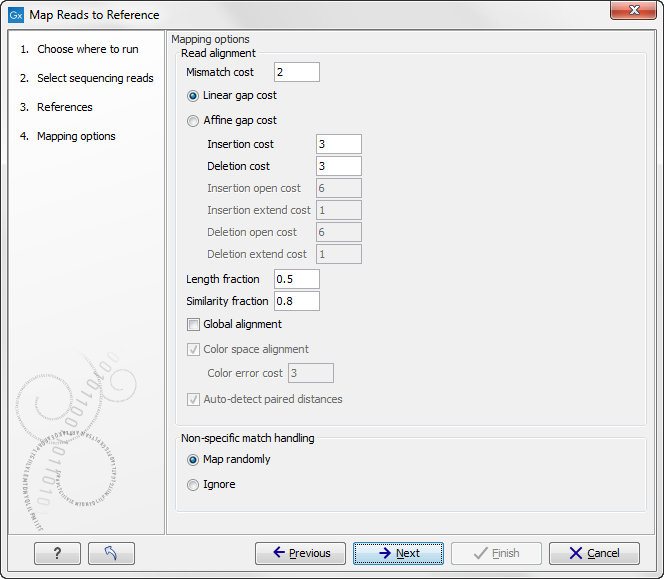
Figure 21.12: Setting parameters for the mapping.
The first parameter allows the mismatch cost to be adjusted:
- Mismatch cost
- The cost of a mismatch between the read and the reference sequence.
After setting the mismatch cost you need to choose between linear gap cost and affine gap cost:
- Linear gap cost
- The cost of a gap is computed directly from the lenght of the gap and the insertion or deletion cost. This model often favors small, fragmented gaps over long contiguous gaps.
- Affine gap cost
- An extra cost associated with opening a gap is introduced such that long contiguous gaps are favored over short gaps.
Depending on the model you chose, you need to set two different sets of parameters that control how gaps in the read mapping are penalized. If you choose linear gap cost, you must set the insertion cost and the deletion cost:
- Insertion cost
- The cost of an insertion in the read (a gap in the reference sequence).
- Deletion cost
- The cost of a deletion in the read (gap in the read sequence).
In this case, the cost of an insertion of length ![]() will be
will be
| (21.1) |
and, similarly, the cost of a deletion of length ![]() will be
will be
| (21.2) |
If you chose affine gap cost, you must also set the cost of opening an insertion or a deletion:
- Insertion open cost
- The cost of opening an insertion in the read (a gap in the reference sequence).
- Insertion extend cost
- The cost of extending an insertion in the read (a gap in the reference sequence) by one column.
- Deletion open cost
- The cost of a opening a deletion in the read (gap in the read sequence).
- Deletion extend cost
- The cost of extending a deletion in the read (gap in the read sequence) by one column.
Using affine gap cost, an insertion of length ![]() is penalized by
is penalized by
| Insertion open cost |
(21.3) |
and, similarly, a deletion of length
| Deletion open cost |
(21.4) |
In this way long consequtive gaps get a lower cost per column than small fragmented gaps and they are therefore favored.
The score of a match between the read and the reference is always 1. Adjusting the cost parameters above can improve the mapping quality, e.g. when the read error rate is high or the reference is expected to differ significantly from the sequenced organism. For example, if the reads are expected to contain many insertions and/or deletions, it can be a good idea to lower the insertion and deletion costs to allow more of such errors. However, one should also consider the possible drawbacks when adjusting these settings. For example, reducing the insertion and deletion cost increases the risk of mapping reads to the wrong positions in the reference.

Figure 21.13: An alignment of a read where a region of 35bp at the start of the read is unaligned while the remaining 57 nucleotides matches the reference.
Figure 21.13 shows an example using linear gap cost where the read mapper is unable to map a region in a read due to insertions in the read and mismatches between the read and the reference. The aligned region of the read has a total of 57 matching nucleotides which result in an alignment score of 57 which is optimal when using the default cost for mismatches and insertions/deletions (2 and 3 respectively). If the mapper had aligned the remaining 35bp of the read as shown in Figure 21.14 using the default scoring scheme, the score would become:
| (21.5) |
In this case, the alignment shown in Figure 21.13 is optimal since it has the highest score. However, if either the cost of deletions or mismatches were reduced by one, the score of the alignment shown in Figure 21.14 would become 61 and 58, respectively, and thus make it optimal.

Figure 21.14: An alignment of a read containing a region with several mismatches and deletions. By reducing the default cost of either mismatches or deletions the read mapper can make an alignment that spans the full length of the read.
Once the optimal alignment of the read is found, based on the cost parameters described above, a filtering process determines whether this match is good enough for the read to be included in the output. The filtering threshold is determined by two factors:
- Length fraction
- The minimum percentage of the total alignment length that must match the reference sequence at the selected similarity fraction. A fraction of 0.5 means that at least half of the alignment must match the reference sequence before the read is included in the mapping (if the similarity fraction is set to 1). Note, that the minimal seed (word) size for read mapping is 15 bp, so reads shorter than this will not be mapped.
- Similarity fraction
- The minimum percentage identity between the aligned region of the read and the reference sequence. For example, if the identity should be at least 80% for the read to be included in the mapping, set this value to 0.8. Note that the similarity fraction relates to the length fraction, i.e. when the length fraction is set to 50% then at least 50% of the alignment must have at least 80% identity (see figure 21.15).
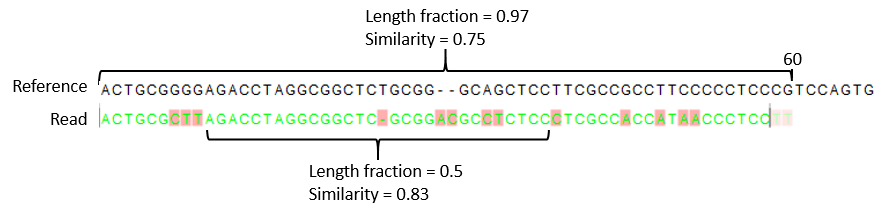
Figure 21.15: A read containing 59 nucleotides where the total alignment length is 60. The part of the alignment that gave rise to the optimal score has length 58 which excludes 2 bases at the left end of the read. The length fraction of the matching region in this example is therefore 58/60 = 0.97. Given a minimum length fraction of 0.5, the similarity fraction of the alignment is computed as the maximum similarity fraction of any part of the alignment which constitute at least 50% of the total alignment. In this example the marked region in the alignment with length 30 (50% of the alignment length) has a similarity fraction of 0.83 which will satisfy the default minimum similarity fraction requirement of 0.8.
By default, mapping is done with local alignment of the reads to the reference. The advantage of performing local alignment instead of global alignment is that the ends are automatically left unaligned if there are many differences from the reference at the ends. For many sequencing platforms, the quality of the bases drop along the read, and a local alignment approach is desirable. Note that the aligned region has to be greater than the length threshold set. If global alignment is preferred, it can be enabled with a checkbox as shown in figure 21.12.
When mapping data in color space (data from SOLiD systems), the color space checkbox is enabled, and a corresponding cost for color errors can be set. If you do not have color space data, these will be disabled and are not relevant. For more details about this, please see the section on Color space which explains how color space mapping is performed in greater detail.
Subsections