Output from the Perform QIAseq FastSelect RNA Gene Expression (ODT-RT primer) workflow
The Perform QIAseq FastSelect RNA Gene Expression (ODT-RT primer) workflow produces outputs as shown in figure 14.10. The figure shows the results of using the workflow on three samples.
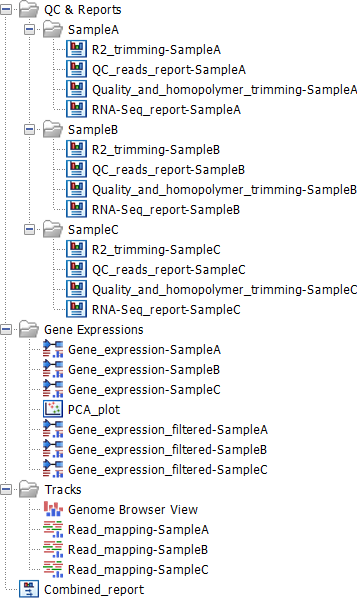
Figure 14.10: Output from the Perform QIAseq FastSelect RNA Gene Expression (ODT-RT primer) workflow when run with three samples.
A summary of the analysis is provided in the "Combined_report" (![]() ).
).
The QC & Reports folder provides detailed reports (![]() ) for individual tools run in the workflow. There is one subfolder per sample. The RNA-seq_report is especially useful as it provides a graphical overview of the RNA-seq analysis. See https://resources.qiagenbioinformatics.com/manuals/clcgenomicsworkbench/current/index.php?manual=RNA_Seq_report.html.
) for individual tools run in the workflow. There is one subfolder per sample. The RNA-seq_report is especially useful as it provides a graphical overview of the RNA-seq analysis. See https://resources.qiagenbioinformatics.com/manuals/clcgenomicsworkbench/current/index.php?manual=RNA_Seq_report.html.
The Gene Expressions folder contains Expression Tracks (![]() ). A "filtered" copy of these tracks is also provided. The filtered tracks are limited to genes that are annotated as being "protein coding" or "lncRNA". Further details about this track type can be found at https://resources.qiagenbioinformatics.com/manuals/clcgenomicsworkbench/current/index.php?manual=Expression_tracks.html.
). A "filtered" copy of these tracks is also provided. The filtered tracks are limited to genes that are annotated as being "protein coding" or "lncRNA". Further details about this track type can be found at https://resources.qiagenbioinformatics.com/manuals/clcgenomicsworkbench/current/index.php?manual=Expression_tracks.html.
Within the Gene Expressions folder is a PCA plot. This will be empty if there is only a single sample. When there are multiple samples, the clustering in the PCA plot can be used for quality control. For more details on PCA plots see https://resources.qiagenbioinformatics.com/manuals/clcgenomicsworkbench/current/index.php?manual=PCA_RNA_Seq.html.
The Tracks folder contains the read mappings. These can be viewed together in the Genome Browser View (![]() ).
).