Calculate TMB Score
Calculate TMB Score takes a variant track and the set of regions to focus on, and calculates a TMB score, i.e. the number of variants per 1 million bases.
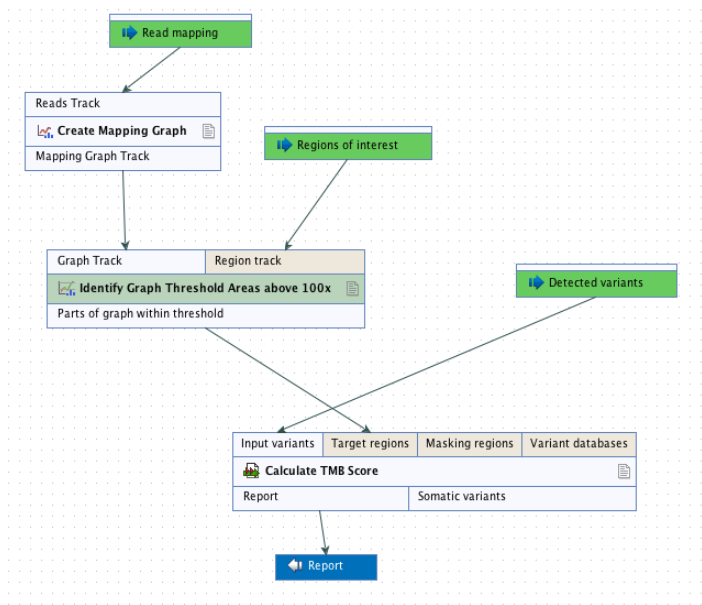
It is recommended that target regions with a coverage lower than 100X are discarded before running the tool. To do so, a workflow including the tools Create Mapping Graph and Identify Graph Threshold Area can be used to generate a target region file only containing target regions with at least 100X coverage (see figure 8.1).

Figure 8.1: Workflow to discard low coverage target regions.
The Calculate TMB Score tool currently considers only SNVs - and discards variants of any other type. First, it filters variants, keeping only variants that lie within exons within ROIs and outside the masking regions. It then applies successively various quality, germline and non-synonymous filters before calculating the TMB score as the a number of somatic variants multiplied by 1 million bases and divided by the length of the Region of Interest (ROI) in megabases (Mb) minus the length of masking regions in megabases (Mb).
Calculate TMB Score is available from the Tools menu at:
Tools | Biomedical Genomics Analysis (![]() ) | Oncology Score Estimation (
) | Oncology Score Estimation (![]() ) | Calculate TMB Score (
) | Calculate TMB Score (![]() )
)
The tool takes a variant track as input.
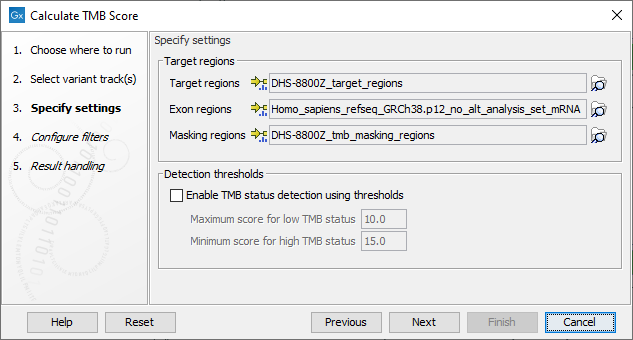
In the next dialog, tracks relevant to the analysis are specified (figure 8.2):
- Target regions A track containing the regions of interest.
- Exon regions An mRNA track containing the exons of interest
- Masking regions Regions that should not be considered
Only variants inside target regions and exons, and not within regions annotated on the masking track, are considered when calculating the TMB score.

Figure 8.2: Specifying tracks and parameters for calculating a TMB status.
In addition, it is possible to enable the calculation of a TMB status based on a low and a high threshold, and which will appear as an additional item on the TMB report. The default values of 10 and 15 respectively have been chosen based on internal benchmark analyses of lung cancer cell lines and different tissue cancer samples. Given the lack of standardization of methods and the heterogeneity of tumor mutation burden across many tumor types, it is difficult to establish cutoff values. Thresholds should be set according to the samples analyzed.
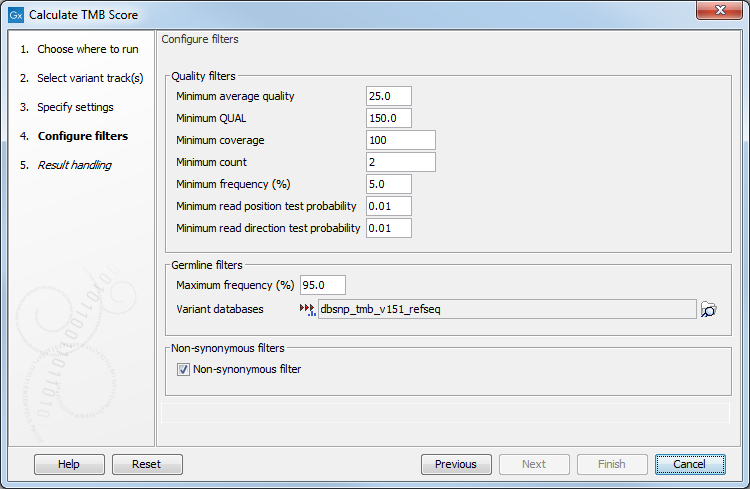
In the next dialog (figure 8.3), it is mandatory to provide a variant database of known germline variants as an input for filtering germline variants.

Figure 8.3: Specifying tracks and parameters for calculating a TMB score.
The parameters that can be configured are as follow:
- Quality filters
- Minimum average quality The Avg Q of reads calculates the amount of sequences that feature individual PHRED-scores in 64 bins from 0 to 63. The quality score of a sequence is calculated as arithmetic mean of its base qualities. PHRED-scores of 30 and above are considered high quality.
- Minimum QUAL Measure of the significance of a variant, i.e., a quantification of the evidence (read count) supporting the variant, relative to the coverage and what could be expected to be seen by chance, given the error rates in the data. The mathematical derivation depends on the set of probabilities of generating the nucleotide pattern observed at the variant site (1) by sequencing errors alone and (2) under the different allele models the variant caller allows. Qual is calculated as -10log10(1-p), p being the probability that a particular variant exists in the sample. Qual is capped at 200 for p=1, with 200: highly significant, 0: insignificant. In rare cases, the Qual value cannot be calculated for a specific variant and as a result the Qual field will be empty. This value is necessary for certain downstream analyses of the data after export in vcf format. A QUAL value of 10 indicates a 1 in 10 chance that the called variant is an error, while a QUAL of 100 indicates a 1 in
 chance that the called variant is an error.
- Minimum coverage Only variants in regions covered by at least this many reads are called.
- Minimum count Only variants that are present in at least this many reads are called.
- Minimum frequency (%) The frequency is calculated as

(8.1)
Only variants that are present at least at the specified frequency are called. - Minimum read direction test probability Tests whether the distribution among forward and reverse reads of the variant carrying reads is different from that of all the reads covering the variant position. This value reflects a balanced presence of the variant in forward and reverse reads (1: well-balanced, 0: un-balanced).
- Minimum read position test probability Tests whether the distribution of the read positions in the variant carrying reads is different from that of all the reads covering the variant position.
- Minimum average quality The Avg Q of reads calculates the amount of sequences that feature individual PHRED-scores in 64 bins from 0 to 63. The quality score of a sequence is calculated as arithmetic mean of its base qualities. PHRED-scores of 30 and above are considered high quality.
- Germline filters
- Maximum frequency Only variants whose frequency is equal to or lower than the specified value will be considered. Variants with a frequency above this value are considered germline.
- Variant databases Specify a variant database such as dbSNP. Although dbSNP is thought to contain many erroneous calls, these may still be useful for removing variants that are not somatic, for example if they arise from common sequencing artifacts.
- Non-synonymous filter Only amino acids changing variants are kept and considered for the TMB score calculation.
Note that TMB filtering parameters are set conservatively. This is because for panels of 1MB size, a single false positive variant may increase the TMB score substantially.
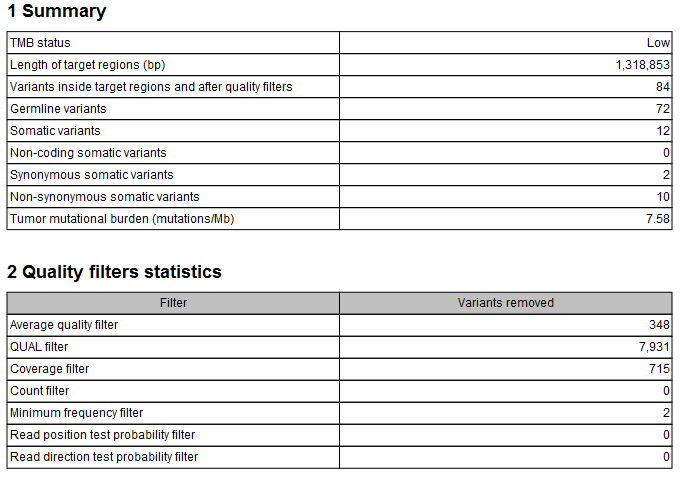
The tool outputs a track of filtered somatic variants, i.e., the variants that remained after the filtering and that were included in the TMB score calculation. However, the main output is a report that includes filtering statistics and the calculated TMB score. It will also include a TMB status if the option was enabled (as shown in figure 8.4). By default, the TMB status is considered low if the TMB score is lower than 10; intermediate if the TMB score is between 10 and 15; and high if the TMB score is larger than 15. It is important to point out again that different cancer types have different somatic mutational load and thresholds should be set according to the samples analysed.

Figure 8.4: A TMB report where the option to detect TMB status was enabled with default threshold values.
In addition, the report lists the length of the target regions, counts of various types of variants, and a value describing the tumor mutational burden calculated as the number of mutations per Mb. The quality filters statistics recapitulates how many variants were removed by the various filters applied by the tool, along with the frequency distributions of input and somatic variants.
The TMB status is assessed with a confidence level based on the size of the target regions included in the TMB score calculation, i.e., those with a coverage of at least 100X. This is illustrated by the color of the TMB status table cell in the report. If the analyzed target region size is below 900,000bp the cell will be colored in red, if it is between 900,000bp and 1,000,000bp it will be colored in yellow and if it is above 1,000,000bp it will not be colored. Note that if low coverage regions were not excluded from the target regions before TMB score calculation, the TMB status confidence level may wrongly be displayed as high.
