Detect MSI Status
Detect MSI Status can be used to detect if a sample contains unstable microsatellites. It is available from the Tools menu at:
Tools | Biomedical Genomics Analysis (![]() ) | Oncology Score Estimation (
) | Oncology Score Estimation (![]() ) | Detect MSI Status (
) | Detect MSI Status (![]() )
)
The tool detects whether a sample is stable or not by comparing it to a baseline composed of multiple microsatellite stable (MSS) samples. Baselines can be created using the Generate MSI Baseline tool (see Generate MSI Baseline). This comparison is performed separately for each microsatellite locus and consists in evaluating whether the variations in the length distribution of the microsatellite observed in the sample are generally the same as the variations observed in the baseline samples.
We recommend that the MSI baseline is generated using samples that are sequenced under the same lab conditions as the sample for which the MSI status is calculated. The Detect MSI Status tool automatically inherits parameters from the selected MSI baseline and uses these parameters for generating a length distribution of the sample. This ensures that the length distributions are comparable between the baseline and the sample.
A microsatellite locus is said to be unstable when the length of the repeat region (e.g., tandem repeat of A nucleotides) is significantly different from the length in microsatellite stable (MSS) samples. To measure the locus lengths in a sample read mapping, the following steps are used:
- For a given microsatellite locus, the flanking signature regions are identified in the reference genome on both sides of the locus.
For example, if the flanking signature is 8 bp long and the sequence is GACTGCTGGAAAAAAAAAATTTCGTAGC
- where the sequence of repeated A's is the microsatellite - the left flanking signature is ACTGCTGG and the right flanking signature is TTTCGTAG.
- The tool searches for the left and right flanking signatures in all reads intersecting the locus.
- The flanking signature might be present more than once in a read. This is increasingly likely with shorter flanking signatures.
To account for this, we compare the nucleotide distribution for the microsattelite locus observed in the read to the reference sequence.
This is done by determining the absolute difference in nucleotide fractions for each of the four nucleotides (A, C, G and T) between the reference sequence and the read sequence.
Reads for which the sum for all four nucleotides is larger than 0.3 are removed.
For example, for a 10 bp long homopolymer A region, the reference sequence has nucleotide fractions of 1.0 A's and 0.0 C's, G's, and T's.
If a read has one A to C mismatch in the homopolymer region, its nucleotide fractions would be 0.9 A's, 0.1 C's, and 0.0 G's and T's.
In this case the sum of the absolute differences would be 0.2, which is smaller than 0.3, hence the read is used in the MSI analysis.
- For every read where both flanking signatures are identified and the nucleotide distribution of the locus is similar to the reference sequence, the length of the locus is used to update a frequency distribution of microsatellite locus lengths. A paired end read is only used if at least one of the reads in the read pair contains both flanking signatures. If, for example, read 1 contains only the left flanking signature (GACTGCTGGAAAAAA) and read 2 contains only the right flanking signature (AAAAAATTTCGTAGC), the read pair cannot be used for MSI detection since it is not possible to determine the length of the microsatellite. If both reads in the read pair contains both the left and right flanking signatures, the reads will count as one (and not two) in the frequency distribution, since the two reads originate from the same DNA fragment.
After counting the locus lengths in all reads, the statistical variation of the length distribution is calculated and compared to the baseline to determine if the locus is stable or unstable. If the proportion of unstable microsatellite loci is higher than a predefined threshold the sample is considered MSI-low or MSI-high depending on the settings.
When running Detect MSI Status, you will first need to select a read mapping. In the next dialog, specify an MSI baseline track (figure 8.5).
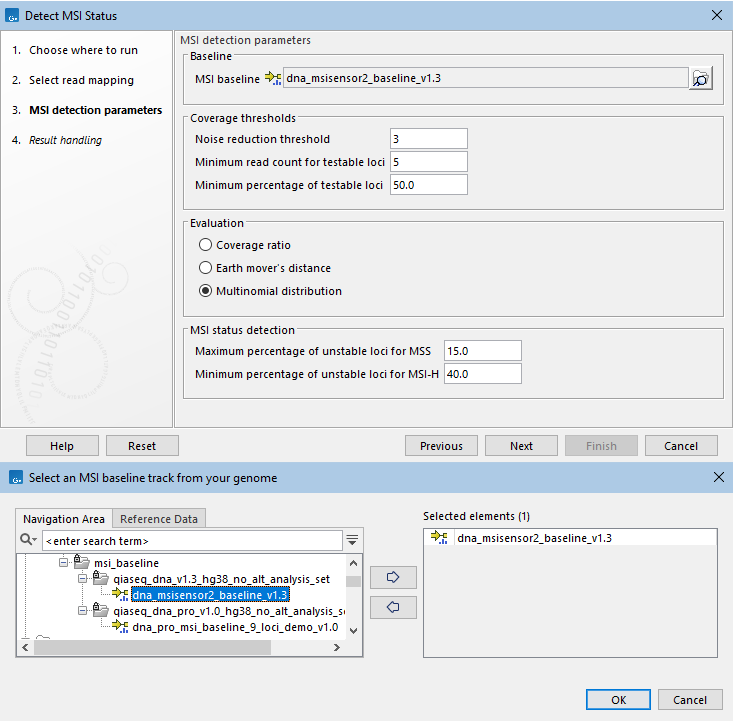
Figure 8.5: Top: Parameters for Detect MSI Status. Bottom: MSI baselines from Reference Data Manager.
|
The following baselines are available in the Reference Data Manager:
|
The following parameters can be adjusted:
- Noise reduction threshold Locus lengths that are not supported by at least this number of reads are filtered away.
- Minimum read count for testable loci A locus is considered testable if the locus length can be determined in at least this number of reads after filtering away noisy locus lengths. If the read count is below this threshold, the locus will be evaluated as N/A.
- Minimum percentage of testable loci The MSI status for a sample is determined if at least this percentage of the loci is testable, i.e. has sufficient read count.
If fewer loci are testable, the status is set to Undetermined.
- Evaluation The stability of the individual loci can be evaluated by three different methods.
The coverage ratio method and the earth mover's distance method share the concept of a baseline length set.
Each locus has its own baseline length set, containing locus lengths, that are found with a high frequency among the baseline samples.
The baseline length set is created by determining all locus lengths, for which the frequency is at least 75% of the most frequent length in the distribution.
This step is performed for all baseline samples individually, resulting in one or more locus lengths per sample, and the final baseline length set is created by combining the identified baseline lengths from all baseline samples.
- Coverage ratio This method calculates the proportion of reads that have a microsatellite length, which is present in the baseline length set, relative to all reads.
A Z-test is used to compare the sample to the baseline.
The sample is evaluated as unstable if the coverage ratio of the sample is smaller than the average of baseline ratios minus three standard deviations.
- Earth mover's distance This method measures the distance in the locus length distribution between the different bins (lengths) and the baseline length set.
For each bin in the sample distribution, which is not in the baseline length set, we measure the distance to the closest baseline length bin and multiply it with the number of reads in the bin.
Finally, the earth mover's distance is then calculated as the sum over all bins.
A Z-test is used to compare the sample to the baseline.
The sample is evaluated as unstable if the earth mover's distance of the sample is larger than the average of baseline distances plus three standard deviations.
- Multinomial distribution This method estimates the probability for deletion from a multinomial distribution model. It compares the observed locus length to the length in the reference genome and calculates the probability of the locus being shorter than the reference length. A Z-test is used to compare the sample to the baseline. The sample is evaluated as unstable if the probability for deletion is larger than the average baseline probability plus three standard deviations.
The coverage ratio and earth mover's distance methods can detect both microsatellite deletions and insertions, while the multinomial distribution is designed to only detect microsatellite deletions. Microsatellite instabilities are normally observed as deletions, however, if the aim is to detect insertions, the multinomial distribution method cannot be used.
The coverage ratio method is recommended for homogeneous baselines with relatively few baseline lengths forming a unimodal distribution. Earth mover's distance and multinomial distribution methods are recommended both for homogeneous and heterogeneous baselines, i.e. for unimodal or multimodal distribution of lengths.
By default, the multinomial distribution method is used, which gives good results across different QIAseq Targeted DNA and DNA Pro panels. We recommend validating the performance of a given MSI baseline using samples with known MSI status. If the results differ from the expectations, you can try another method and/or adjust the other parameters.
- Coverage ratio This method calculates the proportion of reads that have a microsatellite length, which is present in the baseline length set, relative to all reads.
A Z-test is used to compare the sample to the baseline.
The sample is evaluated as unstable if the coverage ratio of the sample is smaller than the average of baseline ratios minus three standard deviations.
- MSI status detection Given the stability of the individual loci, the MSI status of a sample is determined based on whether the percentage of unstable loci is higher than a predefined threshold.
There are two thresholds: one for low instability (MSI-L) and one for high instability (MSI-H).
The percentages are calculated relative to the number of testable loci, as described above.
- Maximum percentage of unstable loci for MSS, set by default at 15%
- Minimum percentage of unstable loci for MSI-H, set by default at 40%
Subsections