Rarefaction for Clonotypes
The rarefaction curve (- interpolated down to 0 clonotypes;
- extrapolated to twice the total number of detected clonotypes.
When only a few clonotypes have been detected, there is a high probability that the next read will represent a new clonotype, causing the curve to rise steeply. As more clonotypes are detected, it becomes increasingly likely that subsequent reads represent clonotypes already observed, so the curve gradually flattens
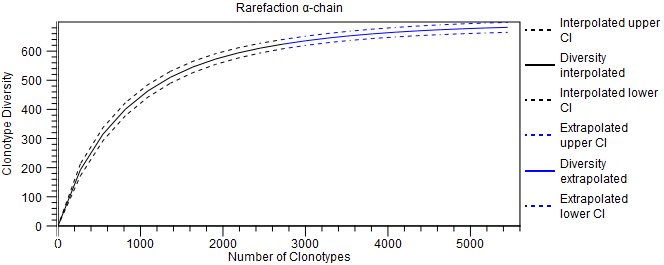
Figure 7.22: Rarefaction plot for the TRA chain. The chain can be changed from the side panel.