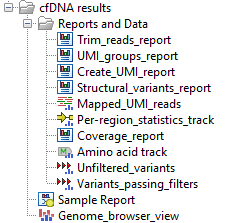
Output from the Identify QIAseq DNA Ultra Somatic Variants template workflow
The Identify QIAseq DNA Ultra Somatic Variants template workflow produces a Genome Browser View (![]() ) as well as the following files, available in a subfolder as seen in figure 12.31):
) as well as the following files, available in a subfolder as seen in figure 12.31):
- A Trim Reads Report (
 ) where you can check that adapters were detected by the automatic detection option.
- A UMI Groups Report (
 ) containing a breakdown of UMI groups with different number of reads, along with percentage of groups and reads.
- A Create UMI Report (
 ) that indicates how many reads were ignored and the reason why they were not included in a UMI read.
- A Structural Variants Report (
 ) giving an overview of the different types of structural variants inferred by the Structural Variant analysis.
- A mapping of the UMI Reads (
 ).
).
- A coverage report (
 ) and a Per-region statistics track (
 ) from the QC for Target Sequencing tool (see http://resources.qiagenbioinformatics.com/manuals/clcgenomicsworkbench/current/index.php?manual=QC_Targeted_Sequencing.html).
- Two variant tracks (
 ): Unfiltered variants contains a list of variants that is output before filtering and Variants passing filters contains filtered variants expected to be high confidence and is also the one used in the Genome Browser View. The difference between the Unfiltered variants track and the Variants passing filters track depends on the settings in the variant filtering steps of the workflow. The Unfiltered variants track is included to allow review of why a variant that was expected in the output would have been filtered out of the Variants passing filters track.
For a definition of the variant table content, see
http://resources.qiagenbioinformatics.com/manuals/clcgenomicsworkbench/current/index.php?manual=_annotated_variant_table.html.
- An Amino Acid track (
 ).
).
- If a read mapping was submitted in the Copy Number Variant Detection dialog, the workflow will also output three CNV tracks (
 ) (Target-, Region- and Gene-level) and a CNV Results report.
- A Sample Report (
 ) that contains compiled QC metrics from other reports and provides an overview of a given sample. The sample report has been set up to report if two QC thresholds have been met. First, a sample must have UMI coverage >3000x at >90 percent of positions in the target regions. This ensures that samples have sufficient coverage for detection of very low frequency variants. Second, the average number of UMIs per read must be >=5. Having many reads per UMI increases the confidence of identified variants. This is particularly relevant when detecting low frequency variants that are only supported by few reads. Both of the QC thresholds can be adjusted in the tool Create Sample Report.

Figure 12.31: Output from the Identify QIAseq DNA Ultra Somatic Variants template workflow.
