Scatter plot for Clonotype Sample Comparison
The scatter plot (
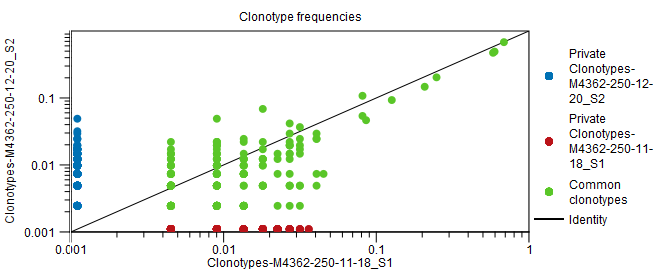
Figure 7.27: Scatter plot with clonotype frequencies for a particular chain type. Note that private clonotypes have frequencies 0 in one of the samples. Due to the log scale, they cannot be plotted at frequency 0.