Quality and mismatches
Next follows a detailed description of which bases in the reference are substituted to which bases in the reads. This information is plotted in different ways with an example shown here in figure 24.33.
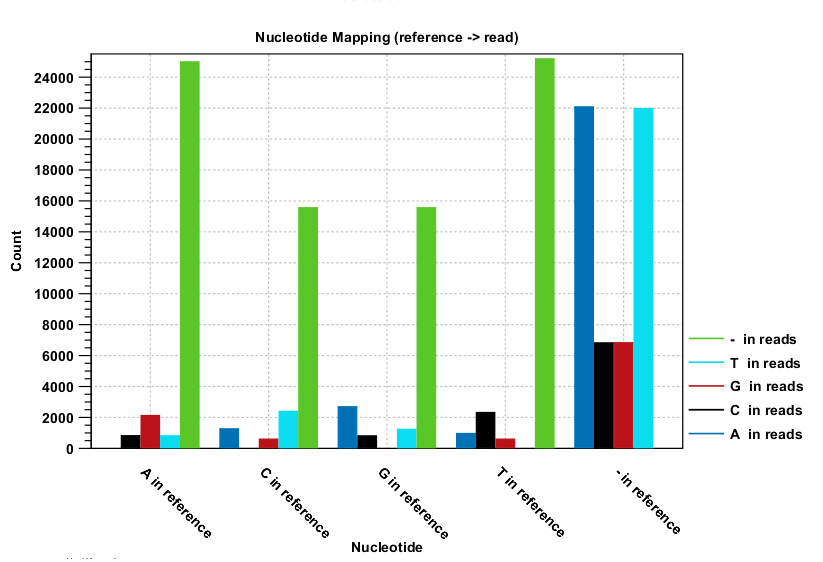
Figure 24.33: The As and Ts are more often substituted with a gap in the sequencing reads than C and G.
This example shows for each type of base in the reference sequence, which base (or gap) is found most often. Please note that only mismatches are plotted - the matches are not included. For example, an A in the reference is more often replaced by a G than any other base.
Below these plots, there are two plots of the quality values for matches and mismatches, respectively. Next, there is a plot of the mismatch fraction for each read position. Typically with quality dropping towards the end of a read, there will be more mismatches towards the end as the example in figure 24.34 shows.
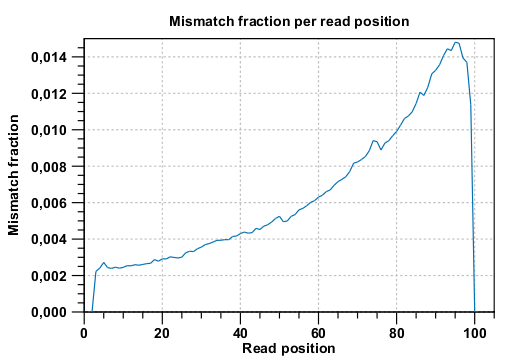
Figure 24.34: There are mismatches towards the end of the reads.
The last plots shows the unaligned read lengths.