Quality control of DNA reads with UMIs
The QIAseq DNA template workflows are designed to support general analysis needs, provided that the input data meets a set of basic quality requirements. These include correct library preparation, reads that follow the expected structure (including the location and length of the UMI), and sufficient overall sequencing coverage. Before adjusting any workflow options, we recommend analyzing the data using the QIAseq Panel Analysis Assistant and reviewing the generated reports.
This section explains how to determine whether the data meets these requirements. A key consideration is that raw sequencing coverage and the number of reads per UMI group do not necessarily reflect the effective coverage after UMI grouping. For example, if a single DNA molecule is amplified many times, it produces many nearly identical reads, but this inflated depth does not increase effective coverage. If the quality requirements described here are not met, variant calls may be unreliable and should be interpreted with caution.
After reviewing the data quality, workflow options may need adjustment to better match specific experimental conditions. For guidance, refer to the tutorial Modifying a Workflow.
The figures in this section illustrate three samples:
- Left sample: too few reads per UMI group
- Middle sample: ideal and well-balanced
- Right sample: excessive reads per UMI group due to over-amplification
Average reads per UMI group
Calculate Unique Molecular Index Groups is present in all QIAseq DNA template workflows intended for analysis of reads containing UMIs, and this tool generates a report summarizing how many reads belong to each UMI group (figure 12.5). According to the QIAseq handbooks, the expected average number of reads per UMI group depends on the amount of input DNA used during library preparation. In general, an average of 2-4 reads per UMI group is ideal, with values closer to 4 typically observed for higher input amounts (e.g., 40 ng).
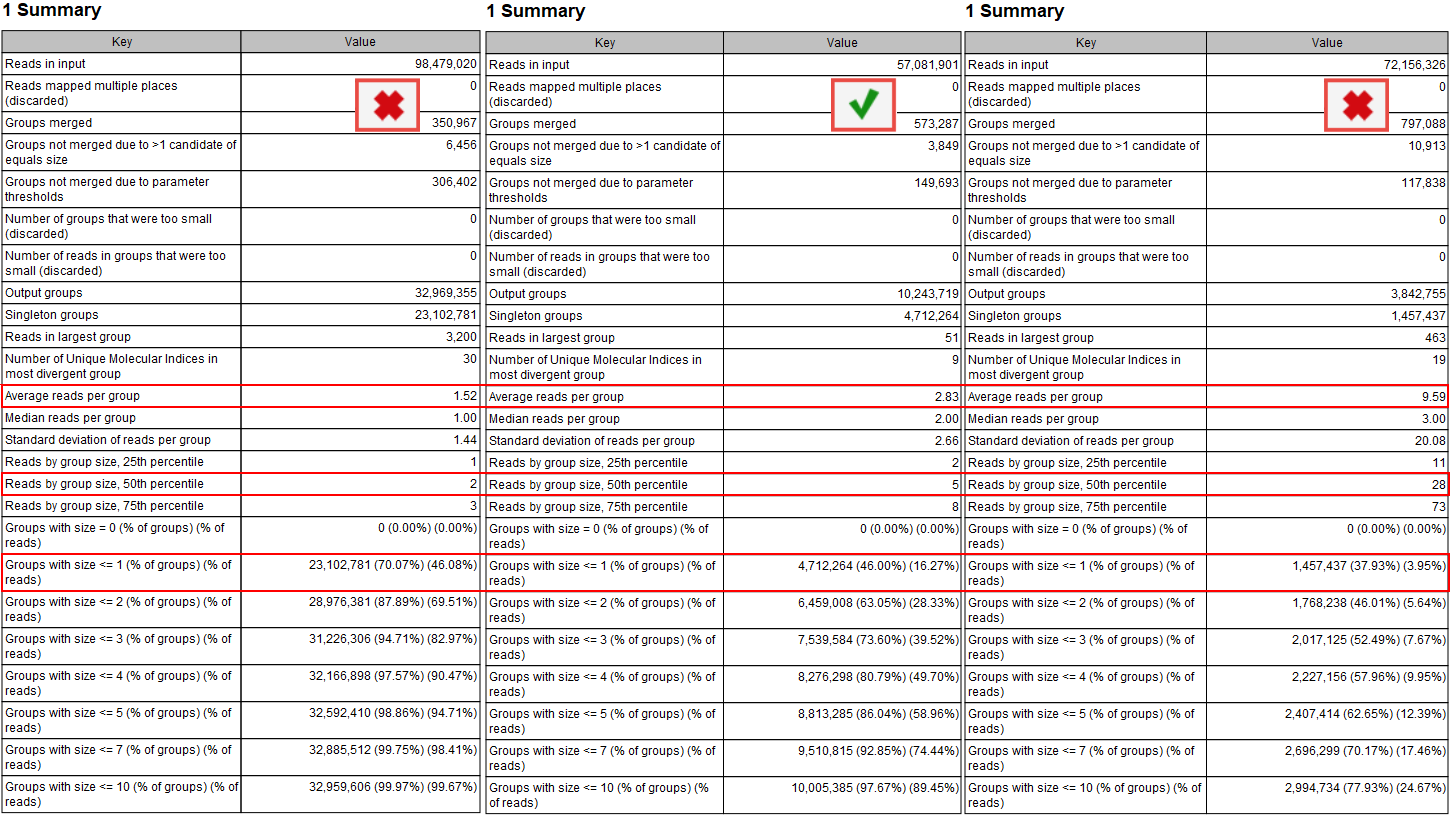
Figure 12.5: The "Groups" section in the report produced by "Calculate Unique Molecular Index Groups" helps evaluate if the sample has an appropriate number of reads per UMI group, particularly through the average and median reads per group size, as well as the number of singleton groups.
The QIAseq DNA template workflows use a Filter on Custom Criteria element to remove low-confidence variants. If the average number of reads per UMI group is too low or too high, these filtering options may need to be adjusted:
- Too few reads per UMI group (< 2 on average)
- In this case, it is not possible to generate a reliable consensus UMI read. Without a consensus, the workflow cannot reduce sequencing errors effectively, which limits the precision of variant calling. In this situation, the Average quality filter, typically located in the Low quality or support filter criteria group, may need to be adjusted to better reflect the reduced consensus support.
- Too many reads per UMI group (> 6-8 on average)
- This typically indicates low DNA input during library preparation, resulting in excessive amplification of the same molecules. This reduces library complexity and lowers the effective coverage because many reads are collapsed into a single consensus. In this situation, the Count filter, typically located in a Low/Medium/High count filter criteria group, may need to be adjusted to account for the reduced number of unique molecules.
Proportion of singletons
Even with an ideal average number of reads per UMI group, many UMI groups may consist of only a single read (figures 12.5 and 12.6). When the proportion of these singleton groups is high, the Average quality filter may need to be adjusted, as described above.
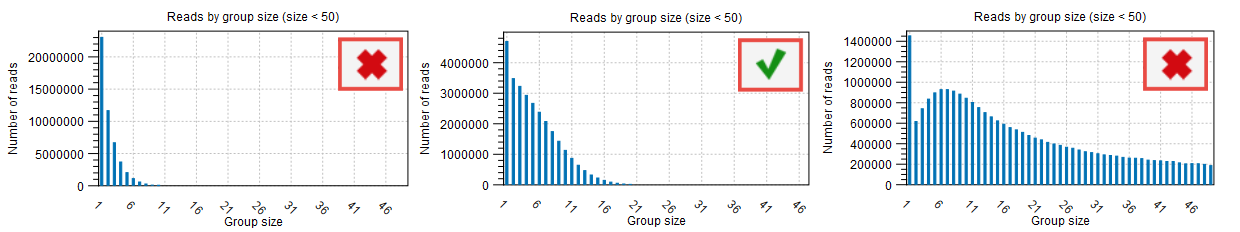
Figure 12.6: The "Reads by group size" sections in the report produced by "Calculate Unique Molecular Index Groups" show the distribution of reads across different group sizes.
Q scores
Create UMI Reads from Grouped Reads is also present in all QIAseq DNA template workflows intended for analysis of reads containing UMIs, and this tool generates a report summarizing the generation of consensus UMI reads, including Q score information for both the input reads and the resulting consensus reads (figure 12.7). The Q score of the consensus reads reflects how well the reads within each UMI group agree with one another and typically increases when the group consists of at least two reads.
When the proportion of singletons is high, the median Q scores of the input and consensus reads will be similar, as can be seen for the sample to the left in figure 12.7. In such cases, filtering based on Average quality may need to be adjusted, as described above.
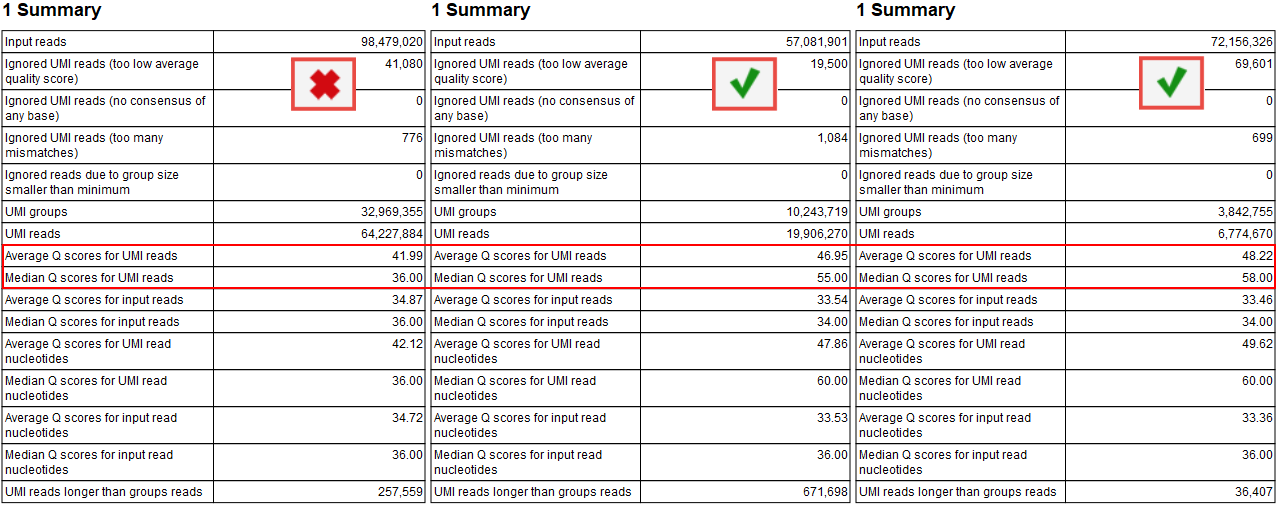
Figure 12.7: The "Summary" section in the report produced by "Create UMI Reads from Grouped Reads" helps evaluate if the Q scores of the UMI consensus reads are higher than those of the input reads.
Composition of the UMIs
The UMIs used during library preparation are random. Their base composition (figure 12.8) is generally independent of factors such as input amount or the number of reads per UMI group, but it can influence the quality of the consensus reads.
For random UMI designs, the percentages of A, C, G, and T within the UMIs are expected to cluster around 25%, as is the case for the sample to the right in figure 12.8. The other two samples show varying degrees of deviation from this pattern. These may reflect the UMI design used in the kit or indicate bias in the UMIs. Such biases can increase the chance that different molecules may be assigned very similar UMIs. This increases the risk that consensus generation merges reads originating from different molecules and may reduce the accuracy of the resulting consensus reads.
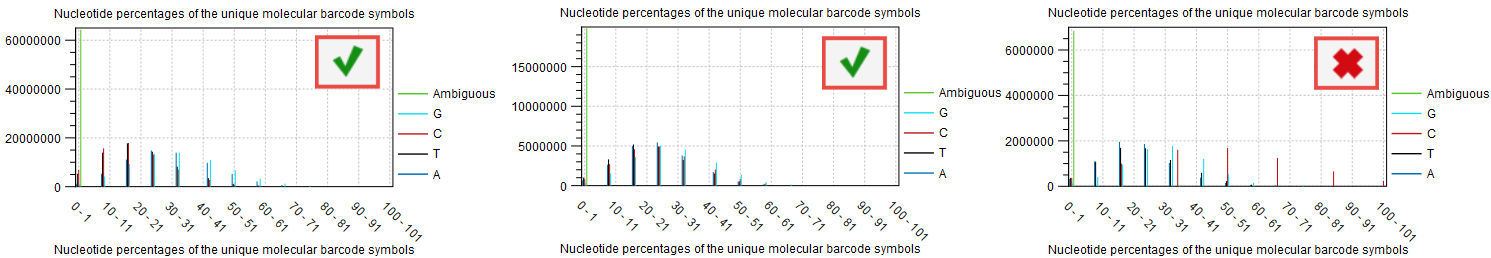
Figure 12.8: The "Nucleotide percentages of the unique molecular barcode symbols" section in the report produced by "Create UMI Reads from Grouped Reads" indicate if the nucleotide distributions cluster around the expected 25%.
Effective coverage and sensitivity when using UMIs
When using UMIs, it is important to distinguish between raw sequencing coverage and the effective coverage after UMI grouping. Consensus generation reduces the number of reads that ultimately contribute to variant calling. This reduction is expected and is the trade-off that allows UMIs to correct many sequencing and amplification errors.
Because UMIs reduce noise, they generally increase the precision of variant calls, particularly for variants present at low frequencies. However, sensitivity depends on the effective coverage, which is the limiting factor for detecting low-frequency variants. Table 12.1 shows the minimum effective UMI coverage required to achieve a given sensitivity (rows) for detecting a variant present at a given frequency (columns). The values are derived by computing the probability of sampling at least two variant-containing UMI consensus reads from the cumulative binomial probability.