Output from the Identify Variants (WGS) workflow
The Identify Variants (WGS) tool produces the following outputs:
- Read Mapping (
 ) The mapped sequencing reads. The reads are shown in different colors depending on their orientation, whether they are single reads or paired reads, and whether they map unambiguously (see http://resources.qiagenbioinformatics.com/manuals/clcgenomicsworkbench/current/index.php?manual=Coloring_mapped_reads.html).
- Read Mapping Report (
 ) The report consists of a number of tables and graphs that in different ways provide information about the mapped reads.
- Two variant tracks (
 ): The Identified Variants track containing the variants identified by the Low Frequency Variant Detection tool after the post-filtering has been applied, and the Indels indirect evidence track which contains the indels inferred by the Structural Variant Caller. When holding the mouse over the detected variants in the Track List, a tooltip appears with information about the individual variants. You will have to zoom in on the variants to be able to see the detailed tooltip.
- Genome Browser View (
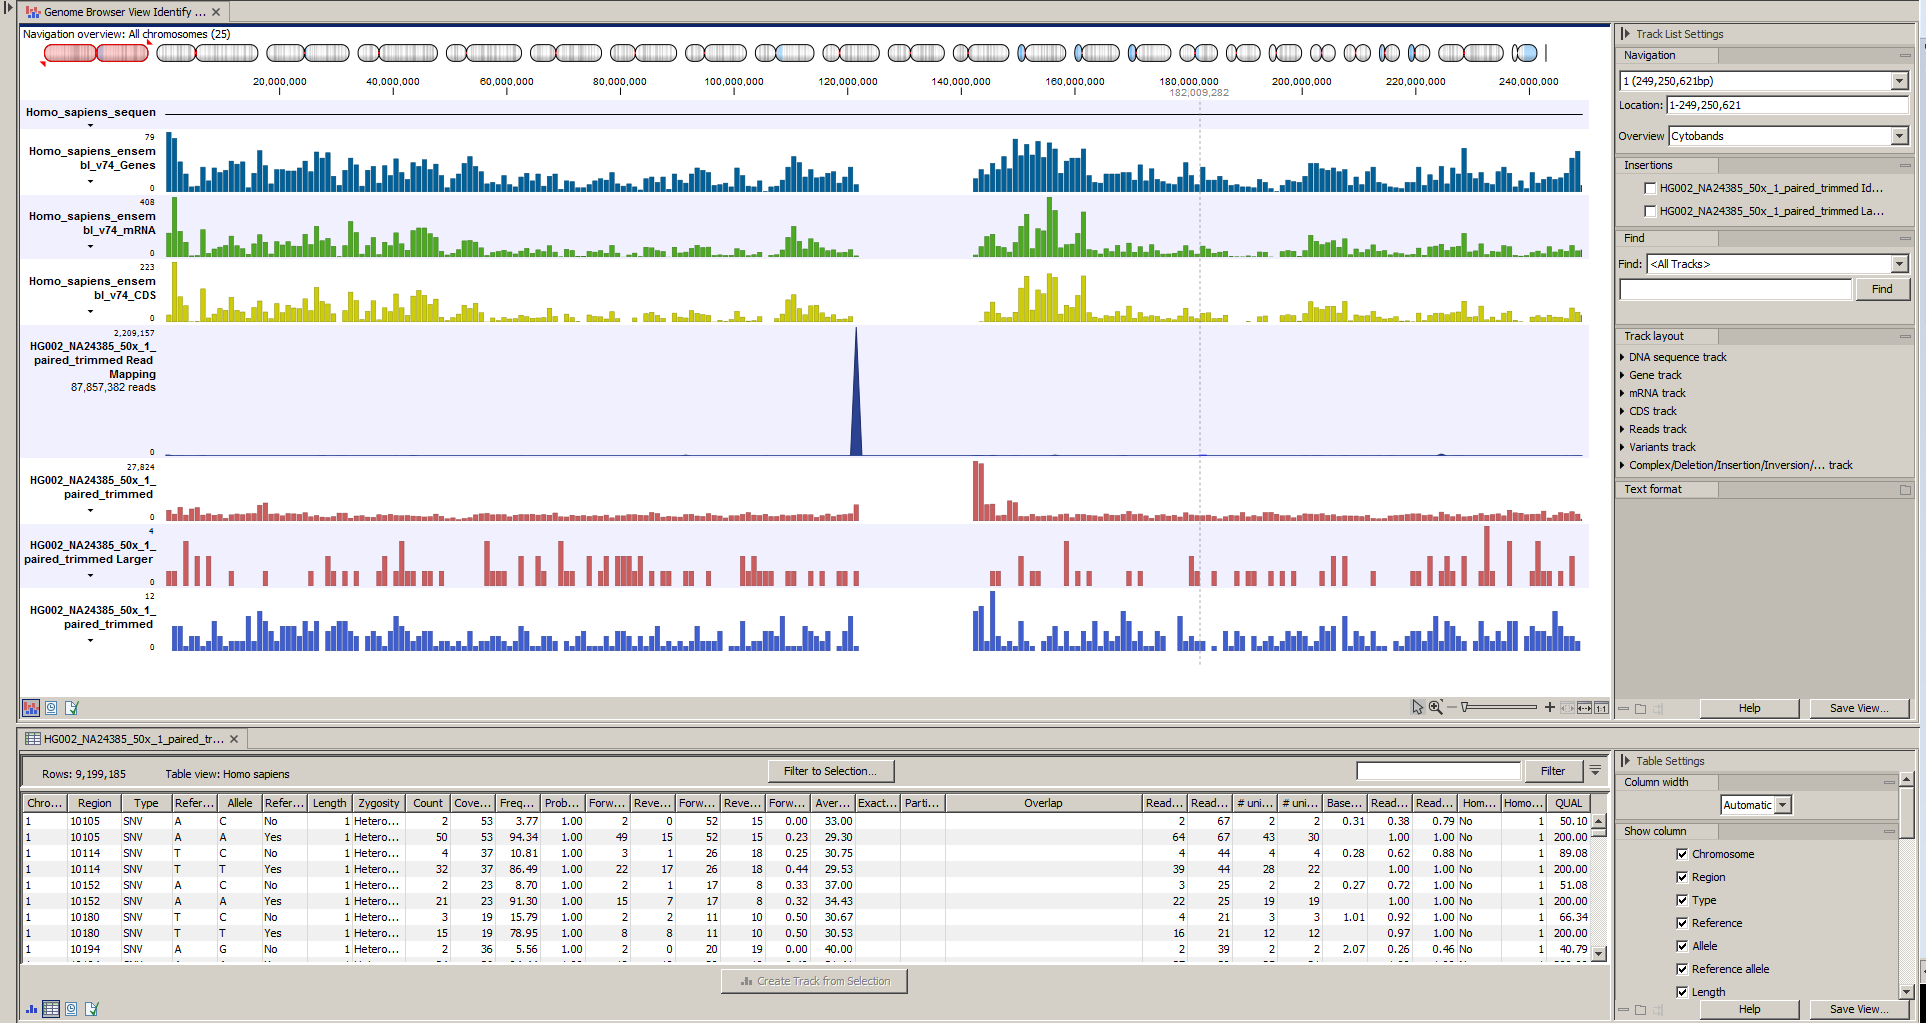
 ) A Genome Browser view containing the collection of tracks presented together. Shows the annotated variant track together with the human reference sequence, genes, transcripts, coding regions, the mapped reads, the identified variants, and the Indels indirect evidence variants (see figure 17.4).
Before looking at the identified variants, we recommend that you first take a look at the mapping report to see the performance of the mapping. E.g., check that at least 90% of the reads map to the human reference sequence.
Next, open the Genome Browser View (see figure 17.21). It lists the track of the identified variants in context to the human reference sequence, genes, transcripts, coding regions, and mapped sequencing reads.

Figure 17.21: The Genome Browser View allows easy inspection of the identified variants in the
context of the human genome.
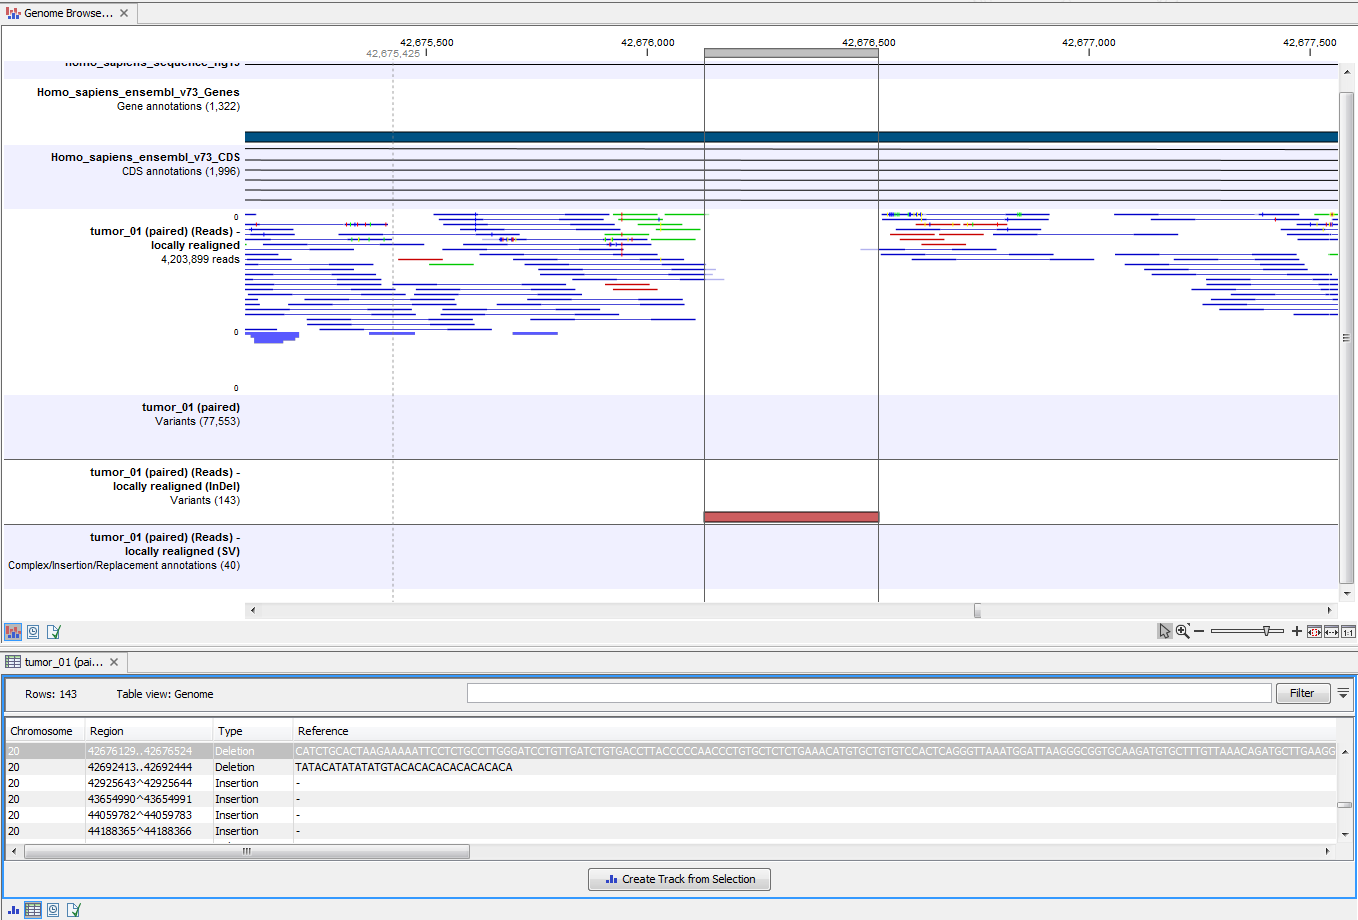
By double-clicking on the Indels indirect evidence variant track in the Genome Browser View, a table will be shown that lists all inferred larger insertions and deletions (see figure 17.22).

Figure 17.22: This figure shows a Genome Browser View with an open track table. The table allows deeper inspection of the identified variants.
