Output from the Identify Variants (WES) workflow
The Identify Variants (WES) tool produces the following outputs:
- Read Mapping (
 ) The mapped sequencing reads. The reads are shown in different colors depending on their orientation, whether they are single reads or paired reads, and whether they map unambiguously (see http://resources.qiagenbioinformatics.com/manuals/clcgenomicsworkbench/current/index.php?manual=Coloring_mapped_reads.html).
- Target Regions Coverage (
 ) The target regions coverage track shows the coverage of the targeted regions. Detailed information about coverage and read count can be found in the table format, which can be opened by pressing the table icon found in the lower left corner of the View Area.
- Target Regions Coverage Report (
 ) The report consists of a number of tables and graphs that in different ways provide information about the targeted regions.
- Three variant tracks (
 ): Two from the Variant Caller: the Unfiltered Variants is output before the filtering steps, the Variants passing filters is the one used in the Genome Browser View (see
.
http://resources.qiagenbioinformatics.com/manuals/clcgenomicsworkbench/current/index.php?manual=_annotated_variant_table.html for a definition of the variant table content). The third is the Indels indirect evidence track produced by the Structural Variant Caller. This is also available in the Genome Browser View. The variants can be shown in track format or in table format. When holding the mouse over the detected variants in the Track List, a tooltip appears with information about the individual variants. You will have to zoom in on the variants to be able to see the detailed tooltip.
- Genome Browser View (
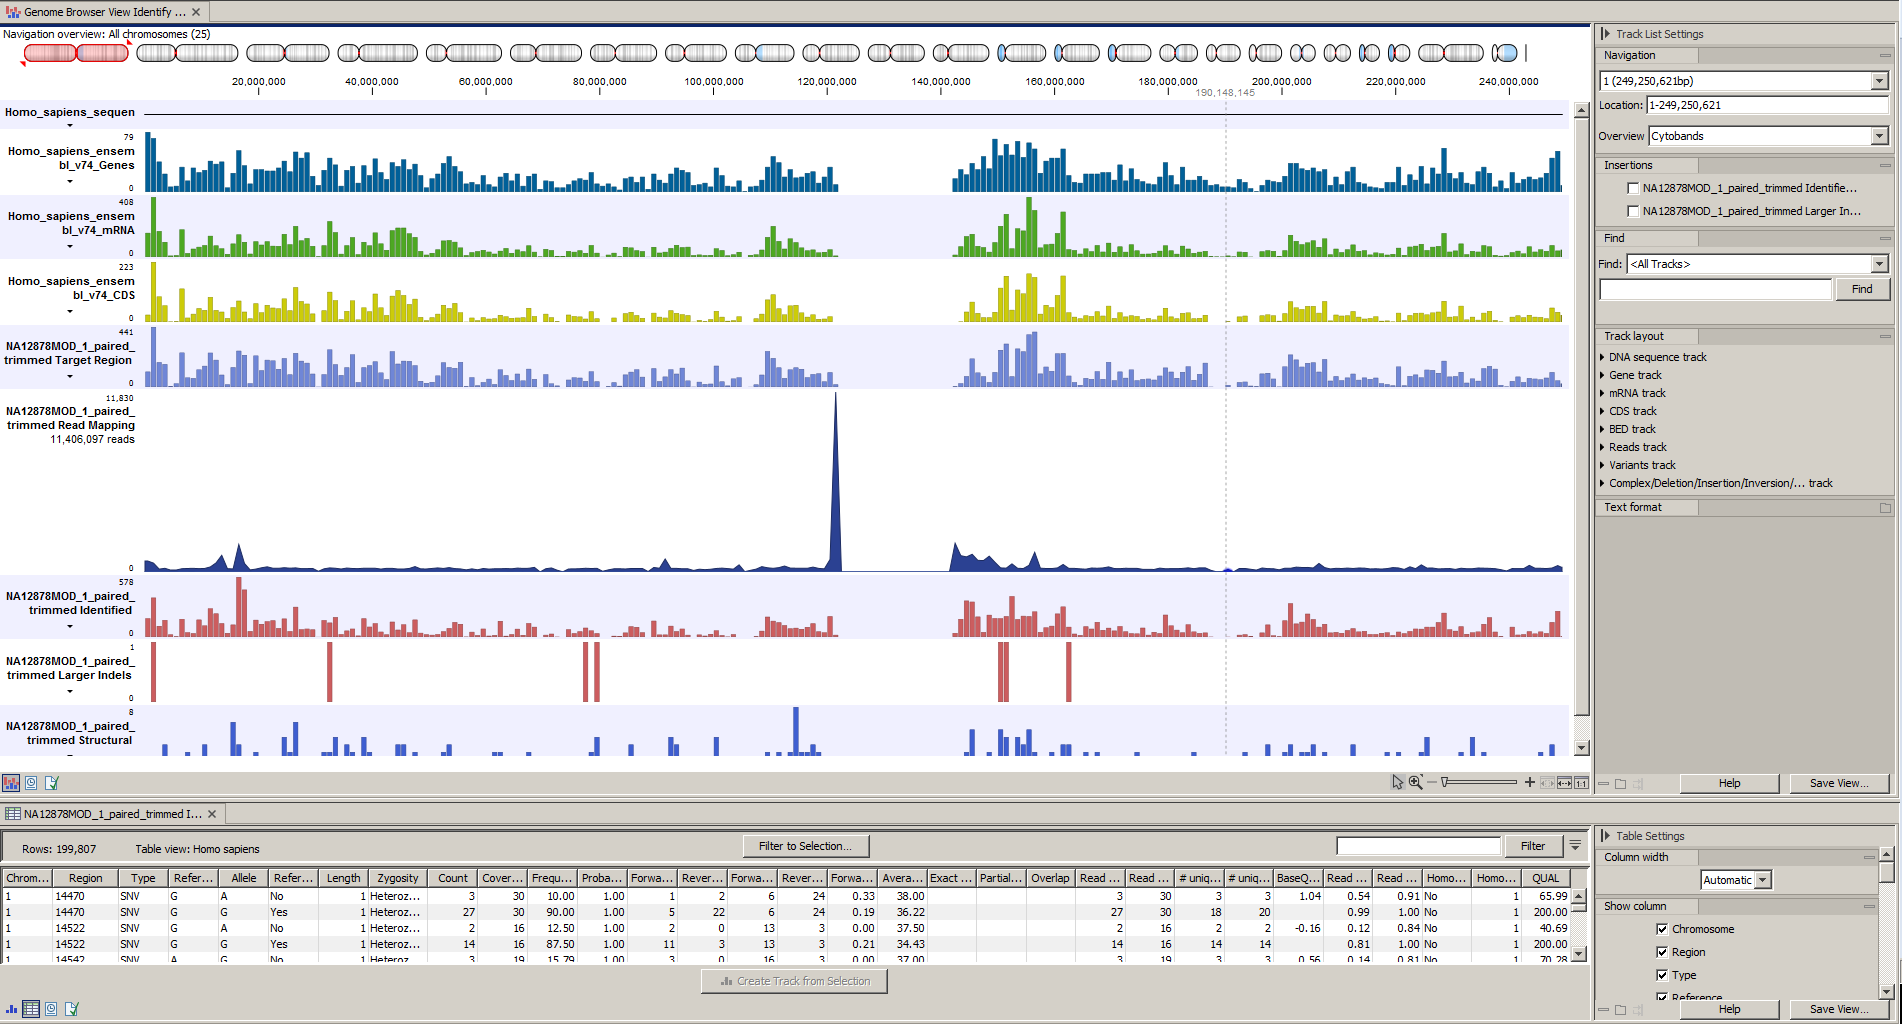
 ) A collection of tracks presented together. Shows the human reference sequence, genes, transcripts, coding regions, the mapped reads, the identified variants, and the indels indirect evidence variants (see figure 18.4).
It is important that you do not delete any of the produced files individually as some of the outputs are linked to other outputs. If you would like to delete the outputs, please always delete all of them at the same time.
We recommend that you first inspect the target region coverage report to check that the majority of reads are mapping to the targeted region, and to see if the coverage is sufficient in regions of interest. Furthermore, check that at least 90% of reads are mapped to the human reference sequence.
Afterwards please open the Track List file (see 18.28).
The Genome Browser View includes the track of identified variants in context to the human reference sequence, genes, transcripts, coding regions, targeted regions and mapped sequencing reads.

Figure 18.28: The Genome Browser View allows you to inspect the identified variants in the context of the human genome.
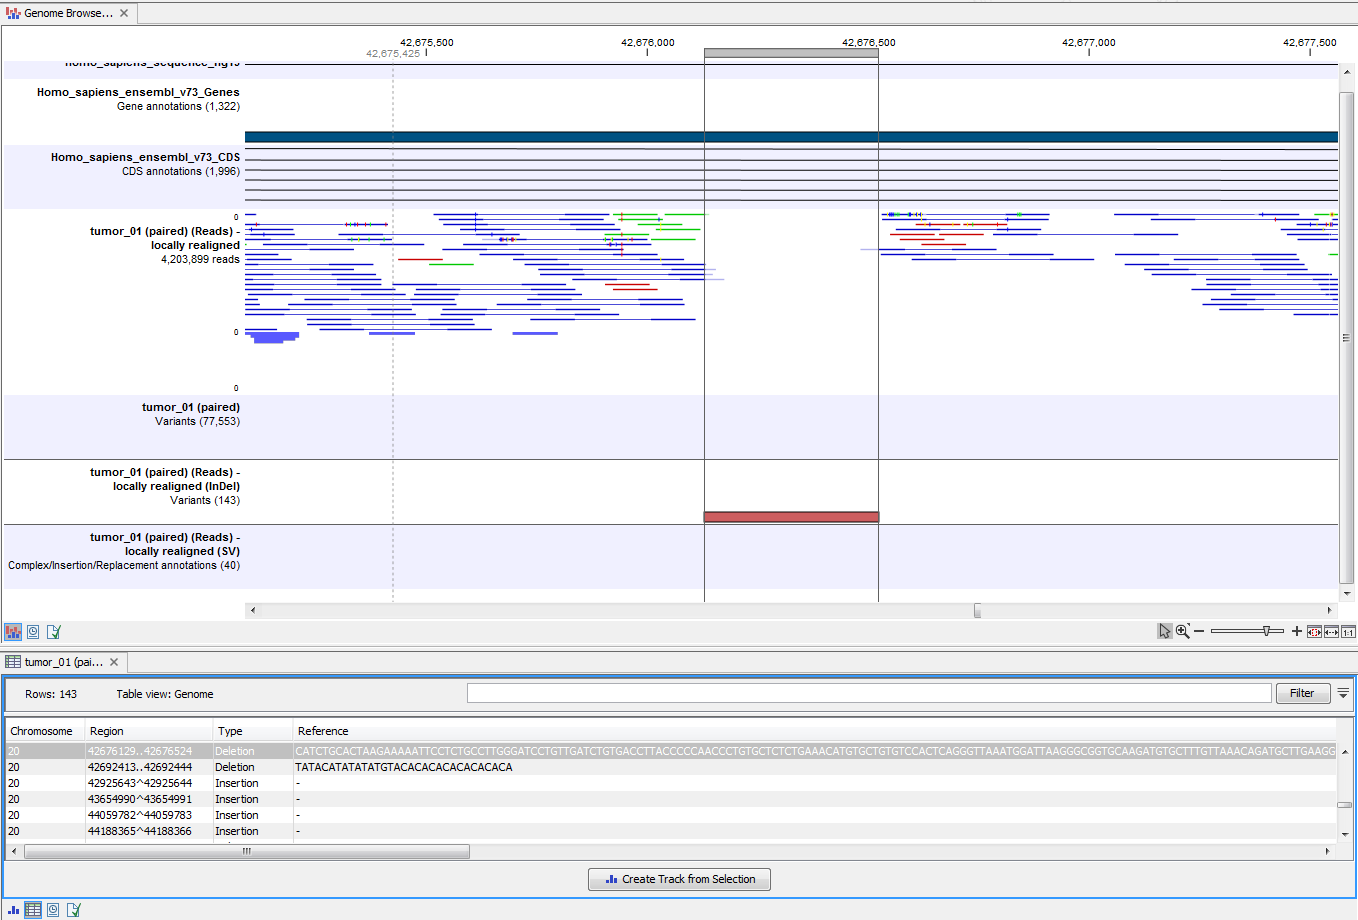
Open the variant track as a table to see information about all identified variants (see 18.29).

Figure 18.29: Genome Browser View with an open track table to inspect identified variants more closely in
the context of the human genome.
