The pairwise comparison table
The table shows the results of
selected comparisons (see an example in
figure 21.18). Since comparisons are
often symmetric, the table can show the results of two comparisons
at the same time, one in the upper-right and one in the lower-left
triangle.
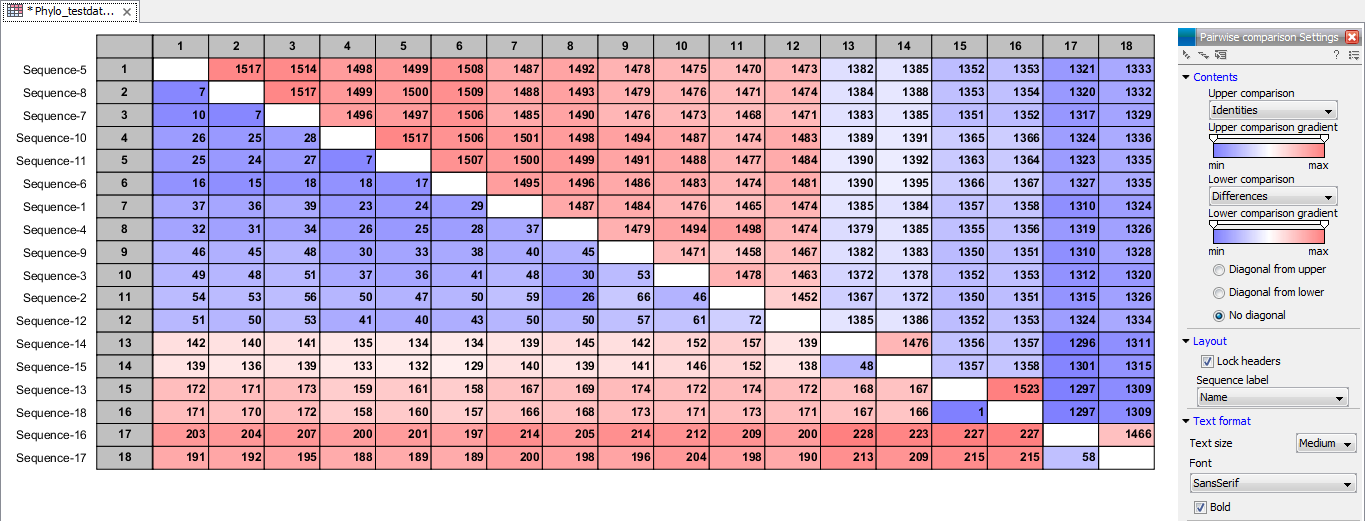
Figure 21.18: A pairwise comparison table.
Note that you can change the minimum and maximum values of the gradient coloring by sliding the corresponding cursor along the gradient in the right side panel of the comparison table. The values that appears when you slide the cursor reflect the percentage of the range of values in the table, and not absolute values.
The following settings are present in the side panel:
- Contents
- Upper comparison Selects the comparison to show in the upper triangle of the table.
- Upper comparison gradient Selects the color gradient to use for the upper triangle.
- Lower comparison Selects the comparison to show in the lower triangle. Choose the same comparison as in the upper triangle to show all the results of an asymmetric comparison.
- Lower comparison gradient Selects the color gradient to use for the lower triangle.
- Diagonal from upper Use this setting to show the diagonal results from the upper comparison.
- Diagonal from lower Use this setting to show the diagonal results from the lower comparison.
- No Diagonal. Leaves the diagonal table entries blank.
- Layout
- Lock headers Locks the sequence labels and table headers when scrolling the table.
- Sequence label Changes the sequence labels.
- Text format
- Text size Changes the size of the table and the text within it.
- Font Changes the font in the table.
- Bold Toggles the use of boldface in the table.