Peak track
The main result of the Transcription Factor ChIP-Seq algorithm is an annotation track containing
the peaks. For each peak the following quantities are reported in the table,
which can be opened by clicking on the table icon (![]() ) in the lower left
corner of the peak annotation track. For more details on some of the values included in the table, see Applying peak shape filters to call peaks.
) in the lower left
corner of the peak annotation track. For more details on some of the values included in the table, see Applying peak shape filters to call peaks.
- Chromosome The chromosome where the peak is located.
- Region The position of the peak.
- Center of peak The center position of the peak. This is determined as the genomic position that matches the peak shape filter best.
- Length The length of the peak.
- Peak shape score The peak shape score of the peak.
- P-value The p-value of the peak.
The peak annotation track is most informative when combined with the read mapping in a Track List (you can see how to create a track list here: http://resources.qiagenbioinformatics.com/manuals/clcgenomicsworkbench/current/index.php?manual=Track_lists.html).
A Track List containing the mapped reads, the Peak track, and the Peak shape score track is shown in figure 33.12.
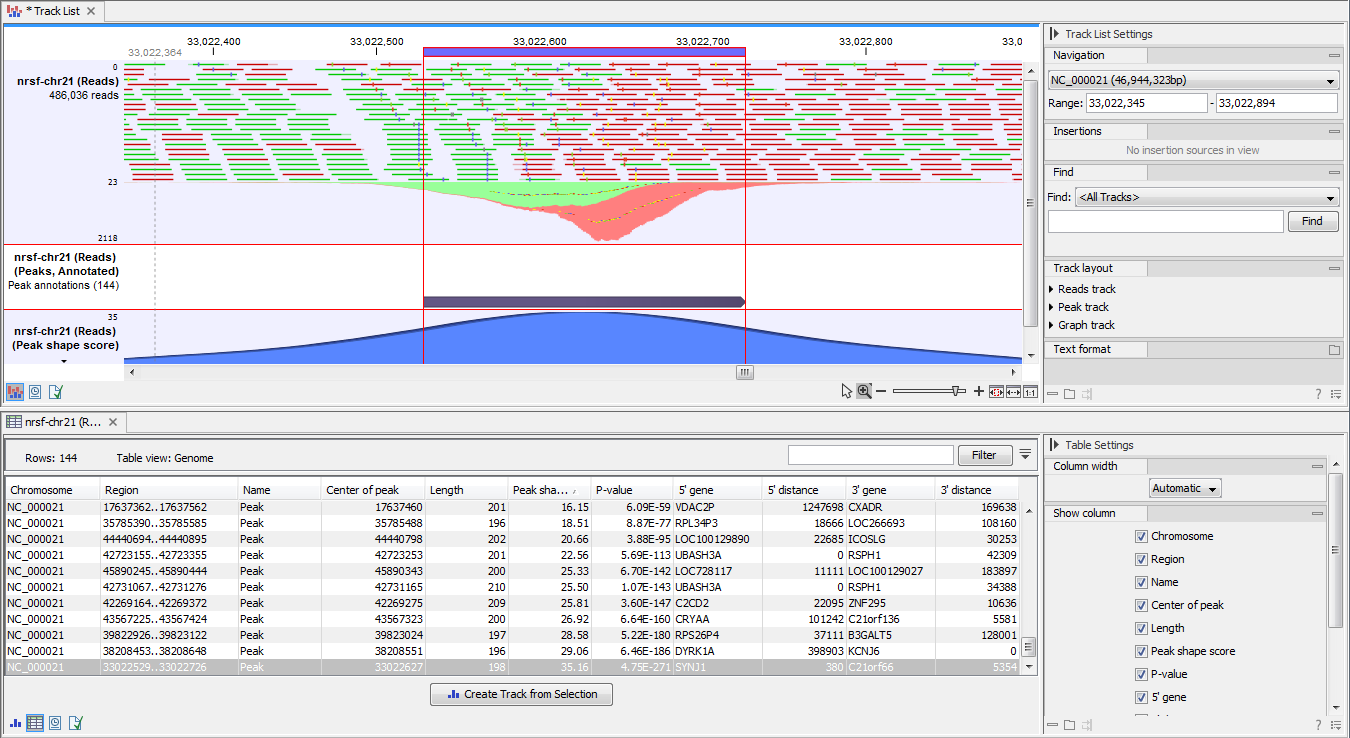
Figure 33.12: Inspection of the result of the Transcription Factor ChIP-Seq tool.
Note that if you make a split view of the table and the peak annotation track
(by holding down the Ctrl key (Cmd on Mac) while clicking on the table
icon (![]() ) in the lower left corner of the peak annotation track), you
will be able to browse through the peaks by clicking in the table, as the peak
annotation track and the table are connected. As a result the view will jump to
the position of the peak selected in the table.
) in the lower left corner of the peak annotation track), you
will be able to browse through the peaks by clicking in the table, as the peak
annotation track and the table are connected. As a result the view will jump to
the position of the peak selected in the table.